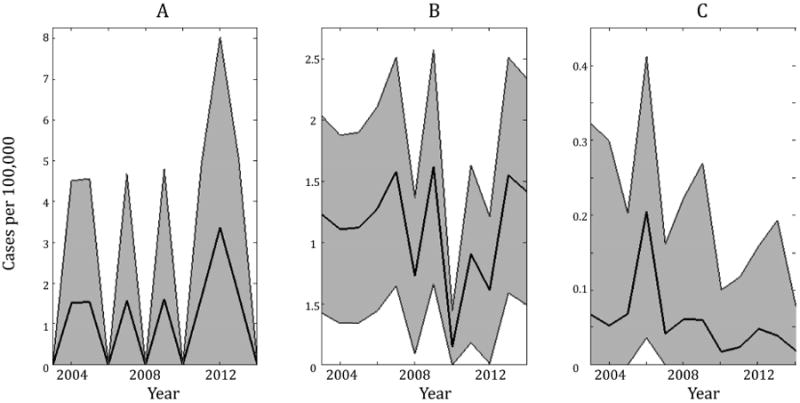
Figure 5.

Age-stratified annual incidence from 2003-2014. Under the assumption that case reports are drawn from a binomial distribution, shading indicates 95% CI using the Fisher information. (A) displays incidence in infants <28d, (B) is 28d - 1 yr, and (C) is the mean incidence across all older age groups. In (C), 95% CIs are displayed as the bounds that fall farthest from the mean across all age groups in each year.
