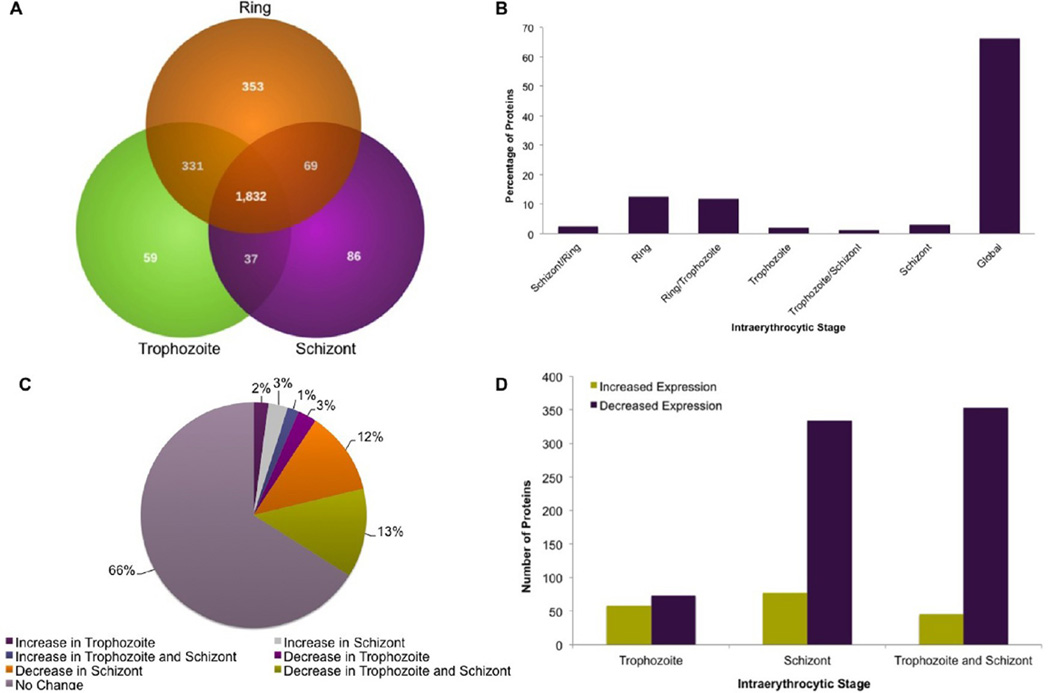
Figure 2.
Comparative analysis of stage-specific protein expression. (A) Venn diagram depicting the distribution of identified malaria proteins over the intraerythrocytic stages. (B) Percentage of globally expressed proteins and proteins quantified at each of the intraerythrocytic stages. (C) Expression level changes as determined by a >1.5-fold difference. (D) Number of proteins up- and down-regulated in each stage in comparison with ring stage expression levels.

