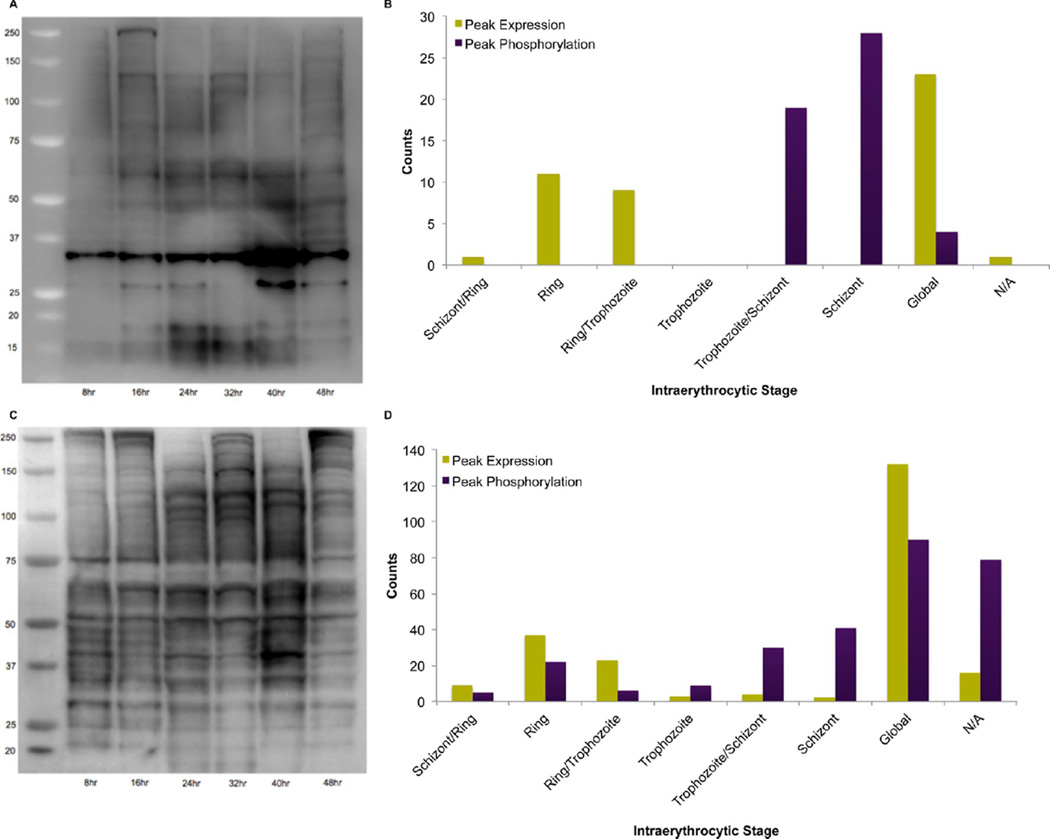
Figure 6.
Phosphorylation profiles of putative MAPK/CDK substrates and tyrosine phosphorylated proteins. (A) Immunoblot analysis using a MAPK/CDK phospho-specific antibody on 8 h time point lysates. (B) Analysis of 45 putative MAPK/CDK substrates revealing the number of proteins with peak expression in each stage and the number of phosphorylation events peaking at each stage. (C) Immunoblot analysis using a phospho-tyrosine antibody on 8 h time point lysates. (D) Stage-specific distribution of proteins containing tyrosine phosphorylation events.

