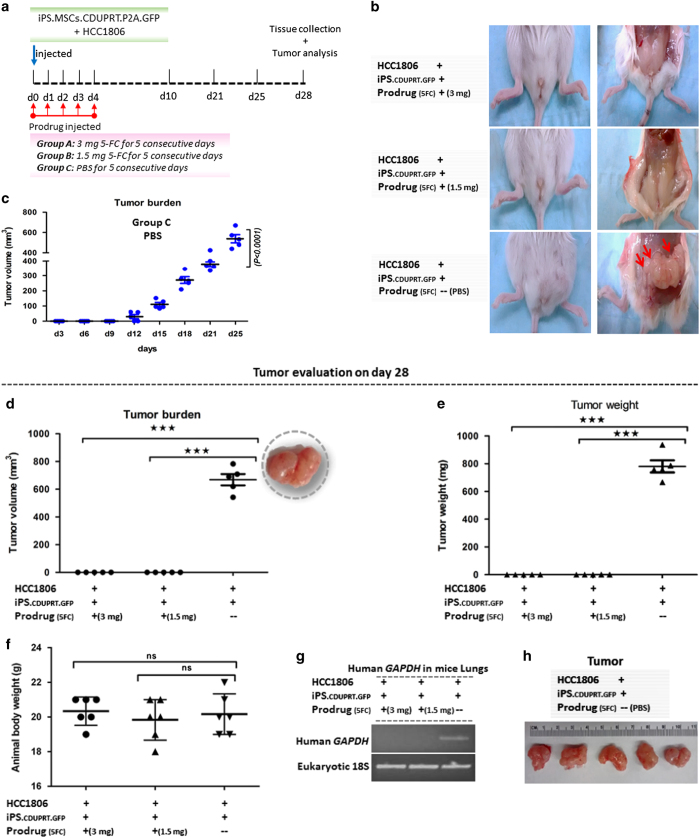
Figure 5.
Effects on tumor growth in mice receiving co-injections of iPS-MSCs-CD and HCC1806. A mixture of 1×10⁶ HCC1806 cells and 1×10⁶ iPS-MSCs-CD were injected into a fourth mammary fat pad of each mouse and then 5-FC or PBS was injected i.p. for 5 consecutive days. (a) Schematic representation of the experiment. (b) Representative images of the mammary glands from treated and control mice before and after killing followed by exposure of the fat pad. (c) Growth curve of the tumor burden for 25 days in mice that received PBS instead of 5-FC. (d) Tumor volume of the treated and control groups on day 28. (e) Tumor weight of the treated and control groups on day 28. (f) Body weights of mice from the treated and control groups on day 28. (g) RT-PCR assays for human GAPDH signal in the mice lungs of the treated and control groups on day 28. (h) Excised tumors of control mice on day 28. Mean (±S.E.M.) tumor growth over time in mice (n=5–6 per group) injected with tumor cells and treated as indicated (***P<0.001; NS, not significant).

