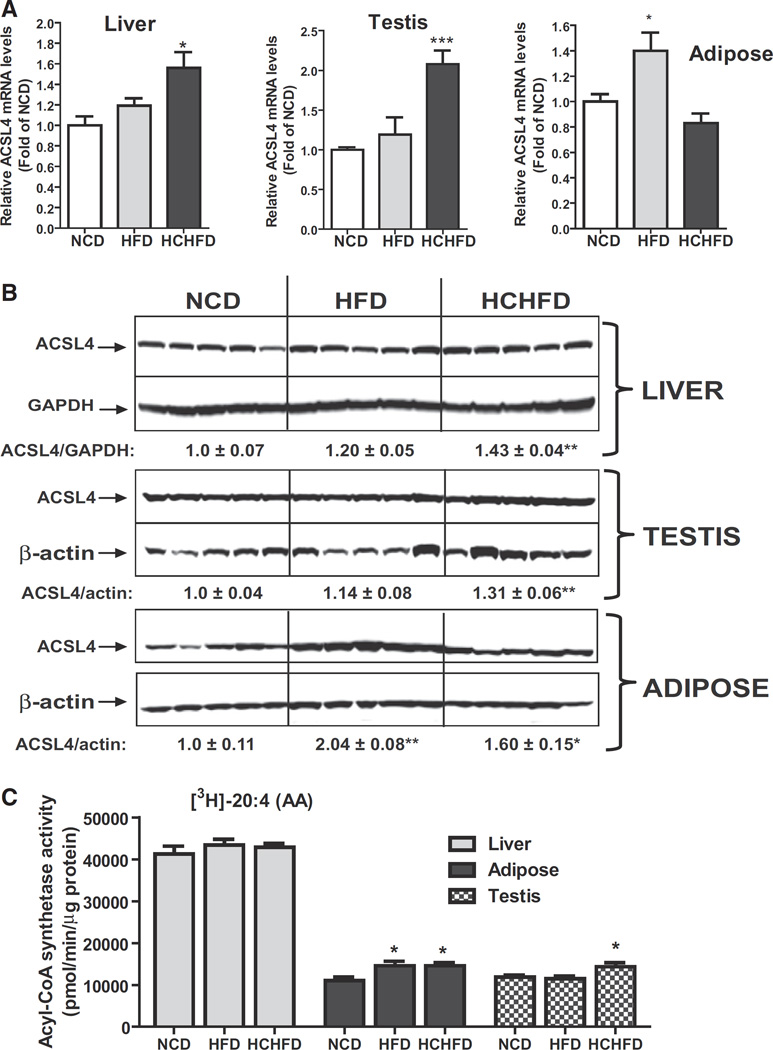
Fig. 1.
Tissue-specific inductions of ACSL4 expression by HCHFD and HFD. (A) Quantitative real-time RT-PCR analysis of ACSL4 mRNA levels in liver, adipose and testis of hamsters of three diet groups. Hamsters were sacrificed and tissues were isolated after two weeks on the indicated diets. Total RNA was isolated from each tissue sample and relative mRNA abundance of ACSL4 was determined by conducting q-PCR and normalized to GAPDH. *p < 0.05, ***p < 0.001 compared to NCD group. (B) Western blot analysis of ACSL4 protein abundance. Individual tissue protein extracts were prepared and protein concentrations were determined. 50 µg of homogenate proteins of individual samples was resolved by SDS-PAGE and ACSL4 protein was detected by immunoblotting using anti-ACSL4 antibody. The membrane was reprobed with anti-β-actin or anti-GAPDH antibody. The protein abundance of ACSL4 was quantified with Alpha View Software with normalization by signals of β-actin or GAPDH. Values are mean ± SEM of 5 samples per group. * p < 0.05 and ** p < 0.01 compared to the NCD group. (C) Measurement of tissue ACSL enzymatic activity. Initial rates of total ACSL activity of individual tissue homogenates from three diet groups were measured using 5 µg of homogenate per sample at 37 °C in the presence of [3H] labeled AA. *p < 0.05 compared to NCD group.

