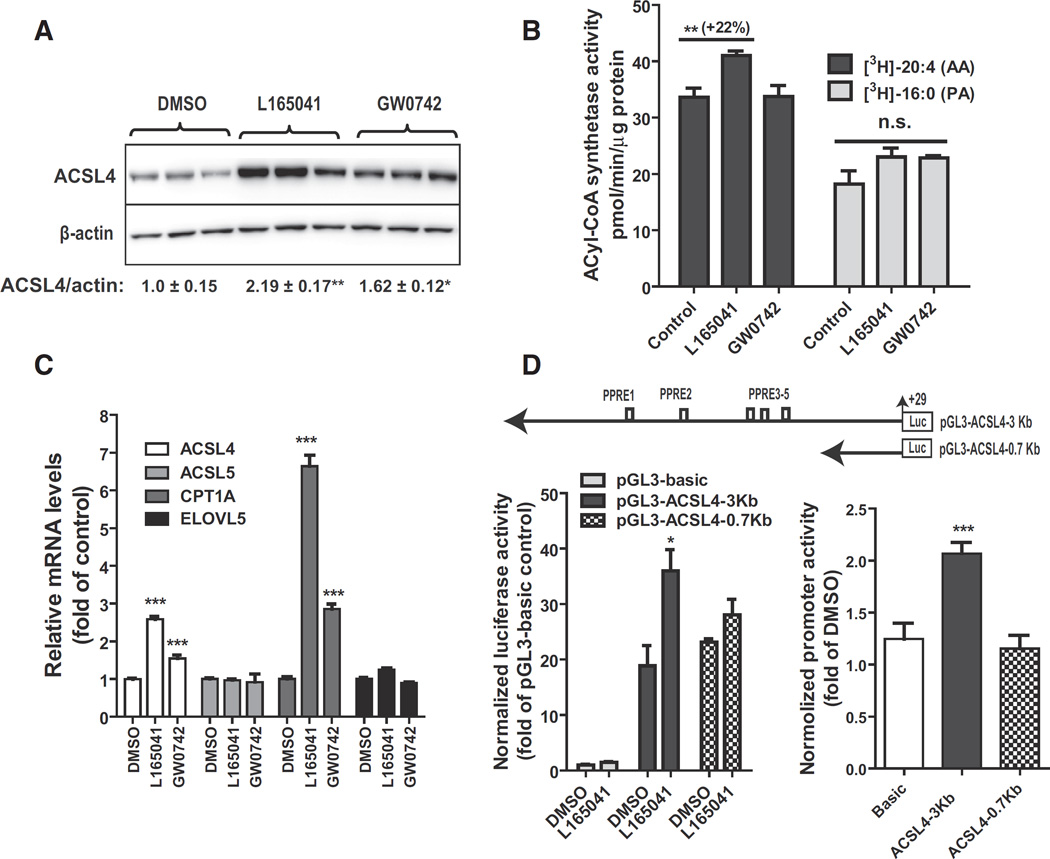
Fig. 4.
Activation of ACSL4 gene transcription by PPARδ agonists in HepG2 cells. HepG2 cells in triplicate wells were cultured overnight in culture medium containing 0.5% FBS, followed by treatment of L165041 (20 µM) or GW0742 (1 µM) for 24 h. In A, total protein lysates were isolated and 30 µg protein per sample was used for SDS-PAGE and Western blotting. In B, initial rates of total ACSL activity in 5 µg of cell homogenate of HepG2 were measured at 37 °C in the presence of [3H] labeled AA or [3H] labeled palmitic acid (PA). In C, total RNA was isolated and gene expression analysis was conducted by q-PCR. In D, HepG2 cells were transfected with pGL3-ACSL4-3Kb or pGL3-ACSL4-0.7Kb. The plasmid pRL-SV40 was cotransfected with ACSL4 promoter constructs. One day post-transfection, cells were treated with 25 µM L165041 for 24 h. Cell lysates were isolated to measure dual luciferase activities. In the left panel, the normalized luciferase activity of pGL3-basic in DMSO treated control cells is expressed as 1. In the right panel, the relative luciferase of each vector in ligand treated cells was compared to that in the control. Each value represents the mean ± SEM of five independent transfection experiments in which triplicate wells were assayed. * p < 0.05 and *** p < 0.001 compared to the DMSO control.

