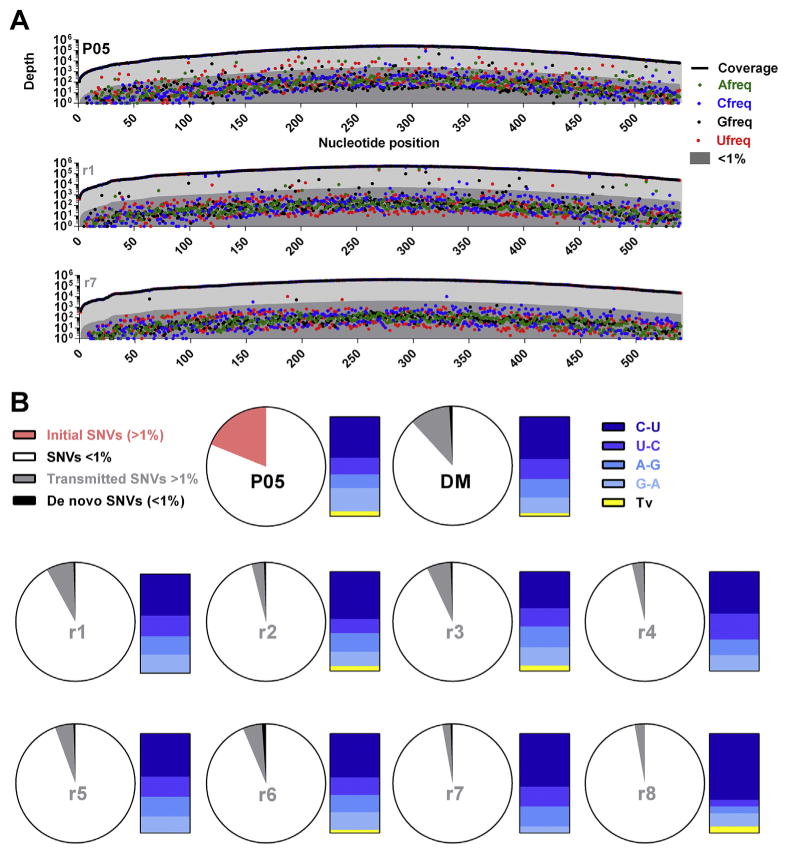
Fig. 2. SNV frequencies pre- and post-transmission.
(A) Cross-sectional detection of a low-frequency mutational cloud in the patient serum (upper panel) and two example recipient mice (lower panels). The x-axis represents the 540 nucleotides encoding the N-terminus of NS3, while the y-axis represents the depth of nucleotide coverage across this region. Sample identifiers are presented in the top right of individual plots. The thick black line represents total nucleotide coverage at a specific position whilst the frequencies of individual nucleotides are color-coded. Population frequencies above 1% are highlighted in light-grey while frequencies below 1% are highlighted in dark-grey. (B) Proportions of low- and -high frequency transmitted SNVs. Pie charts represent total nucleotides analyzed per sample (540bp). For all samples, SNVs exhibiting variation <1% (low-frequency) are highlighted in white. For the patient sera, the total SNVs exhibiting variation >1% (high-frequency) are highlighted in pink. To visualize whether there was a preference for transmission of high-frequency SNVs, for the donor inoculum and individual recipient mice, SNV >1% which were also detected in the patient inoculum at >1% are highlighted in grey. SNVs present at >1% in recipient mice that remained either undetected or had frequencies <1% in the patient serum are highlighted in black. To the left of each pie chart, high-frequency SNVs are categorized in bar charts for each sample, with different transitional substitutions highlighted in shades of blue and transversions highlighted in yellow.

