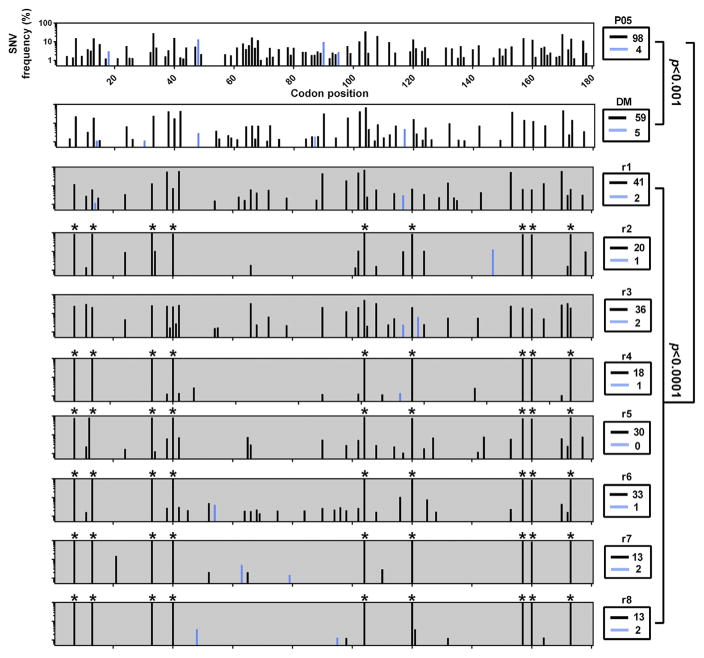
Fig. 3. Synonymous and non-synonymous SNV frequencies pre- and post-transmission.
Cross-sectional quantification of silent and amino acid changing SNVs in the NS3 protease domain in patient serum (top panel, white background), donor inoculum (second panel, white background) and eight recipient human-liver mice (bottom panels, grey background). For each plot, all mutations present at greater than 1% are plotted relative to the P05 consensus master sequence. The x-axis represents the 180 codons of the NS3 protease domain. The y-axis represents the relative percentage frequencies of SNVs across the entire NS3 protease domain, with synonymous (dS, black bars) and non-synonymous (dN, blue bars) frequencies in the viral population. Sample identifiers are presented to the right of individual plots with the absolute number of sites exhibiting variation boxed below. Statistical significance was calculated via Yates corrected Chi2 tests, with adjusted p-values for multiple comparisons. SNVs which become dominant post transmission are marked with *.

