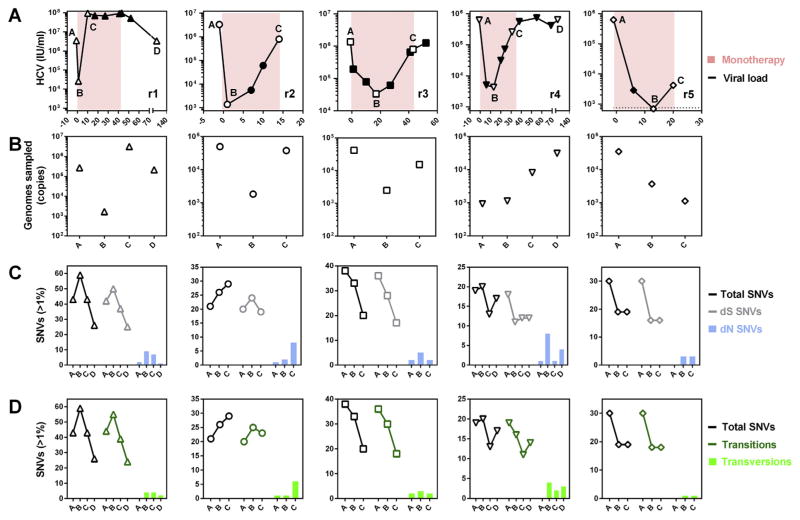
Fig. 4. Longitudinal evolution of the protease domain during PI monotherapy.
(A) Each panel represents monotherapy duration in animals r1-r5, with days presented on the x-axis and viremia on the y-axis. Labeled open symbols represent samples which were available for NGS while the pink background indicates the duration of monotherapy. For all animals, A represents the pre-therapy sample, B represents the pre-breakthrough sample and C represents the post-breakthrough sample. For r1 and r4, an additional sample D was also available after cessation of monotherapy. (B) Viral genomic input into sequencing amplicons. (C) Quantification of total SNVs >1% (black line) and the proportions of synonymous (dS) (grey line) and non-synonymous (dN) (blue bars) SNVs in individual mice over the course of PI monotherapy. (D) Quantification of total SNVs >1% (black line) and the proportions of transitions (green line) and transversions (green bars).

