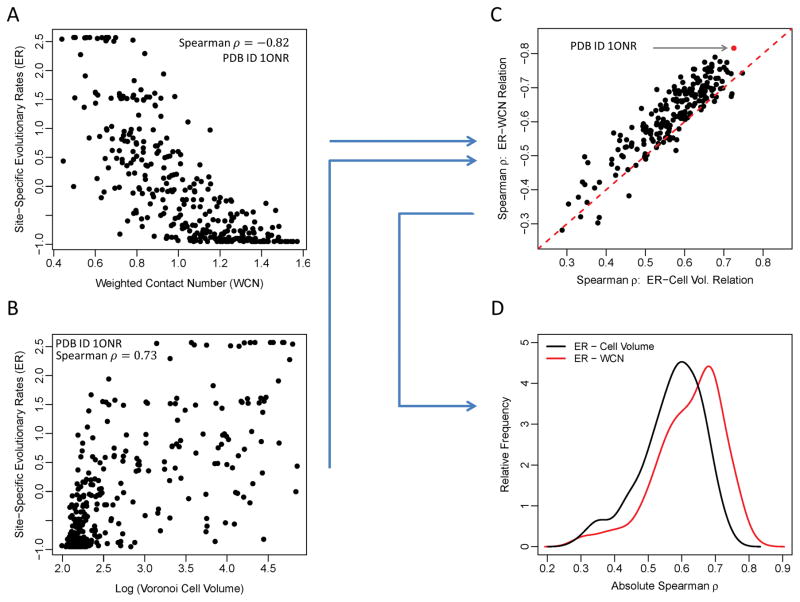
Figure 1.
Schematic of our analysis approach. (A, B) Evolutionary rates at each site in a protein correlate with measures of packing density, such as WCN (A) or Voronoi cell volume (B). Results are shown here for all amino acids in one representative protein (PDB ID: 1ONR, chain A) (C) For all proteins in the data set, the Spearman’s correlation coefficients of ER–WCN and ER–Cell Volume relations are calculated and compared to each other. Each black point represents the two correlation values for one protein. The red dashed line represents the equality line for the absolute values of the correlation strengths. (D) Finally, we convert the set of correlation coefficients into distributions and compare their relative means. On average, WCN correlates more strongly with ER than cell volume does.

