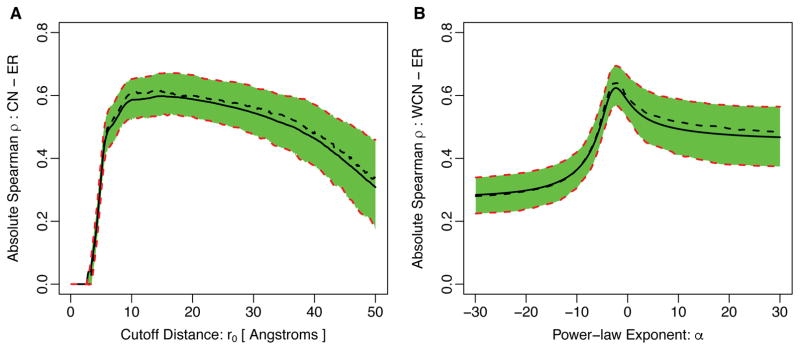
Figure 2.
Absolute correlation of evolutionary rate with (A) Contact Number and (B) Weighted Contact Number for varying degrees of locality of these quantities. In (A), we vary the cutoff parameter r0 in Eq. 2 from 0 to 50Å. In (B), we vary the exponent α in Eq. 4 from −30 to 30. In each plot, the solid black line represents the mean correlation strength in the entire dataset of 209 proteins and the dashed black line indicates the median of the distribution. The green-shaded region together with the red-dashed lines represent the 25% and 75% quartiles of the correlation-strength distribution. Note that for the case of WCN with α > 0 the sign of the correlation strength ρ is the opposite of the sign of ρ with α < 0. In addition, ρ is undefined at α = 0 and not shown in this plot. The parameter values at which the correlation coefficient reaches the maximum over the entire dataset are given in Table 1.

