
Figure 2. CHIR99021 stabilization of CTNNB1 and primary differentiation of piPSC colonies.
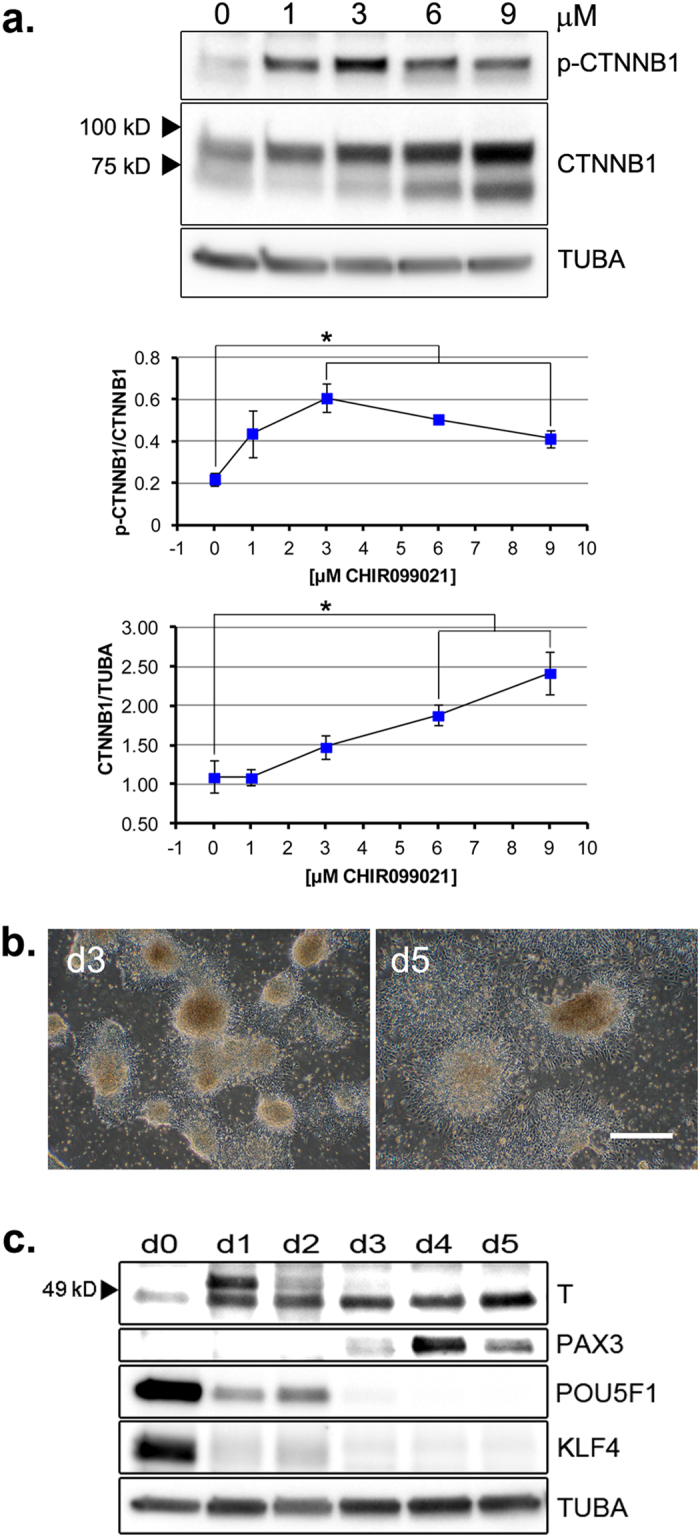
(a) Upper Panel: Western blot detection of CTNNB1 and p-CTNNB1 (total and phospho-S33,37,T41 β-catenin, respectively) following one day differentiation ± CHIR99021, as indicated. Middle Panel: ratios of p-CTNNB1/CTNNB1 bands. Lower Panel: ratios of CTNNB1/TUBA bands. Middle and Lower Panels: Error bars represent n = 3 experimental replicates ± SEM. *Significance (P < 0.05) determined by t-test. (b) Adhesion and outgrowth morphology following transfer of day (d) 2 (Fig. 1d) detached colonies differentiating in 6 μM CHIR99021/DM-1 to PLM-coated culture dishes, for one (d3, left panel) or three (d5, right panel) additional days. Scale bar, 500 μM. (c) Western blot analysis of T, PAX3, POU5F1 and KLF4 expression in ground-state (d0) and differentiating cultures (d1–d5) during the regimen described in (b). (a,c) TUBA detected as an internal protein loading control. Western blots were cropped for clarity. Examples of uncropped blots are found in Supplementary Figure 9.