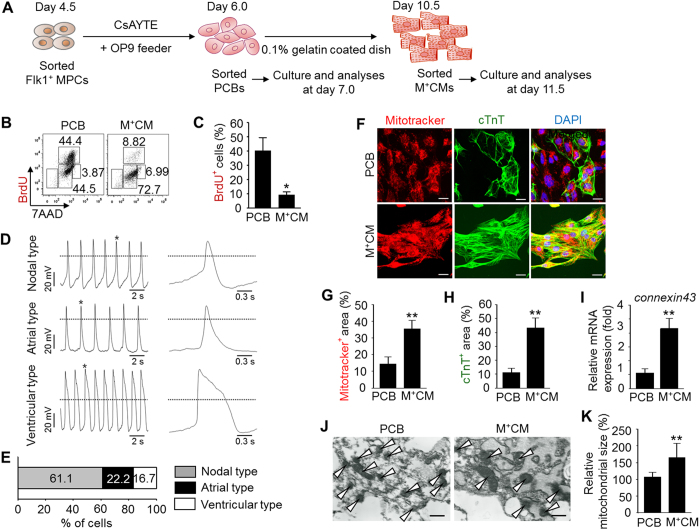
Figure 5. PCBs are in a morphologically and functionally immature state.
(A) Protocol for generation and analyses of PCBs and αMHC-GFP+ cardiomyocytes (M+CMs). (B and C) Representative FACS analysis of BrdU incorporation and the percentage of BrdU+ cells in PCBs and M+CMs. Each group, n = 3. (D and E) 3 different types (nodal, atrial, and ventricular type) of action potentials and percentile distribution in M+CMs. Each group, n = 3. Dotted lines indicate zero voltage level. (F–H) Images showing Mitotracker+ mitochondria. cTnT+ sarcomere and DAPI+ nuclei, and comparisons of Mitotracker+ and cTnT+ areas in PCBs and M+CMs. Scale bars, 20 μm. Each group, n = 6. (I) Relative mRNA expression levels of connexin43 gap junction in PCBs and M+CMs. Each group, n = 3. (J and K) Transmission electron microscope images showing the mitochondrial morphology and cristae (white arrow heads) and quantification of mitochondrial size in PCBs and M+CMs. Scale bars, 500 nm. Each group, n = 8. In all graphs, *p < 0.05 and **p < 0.01 versus PCB.

