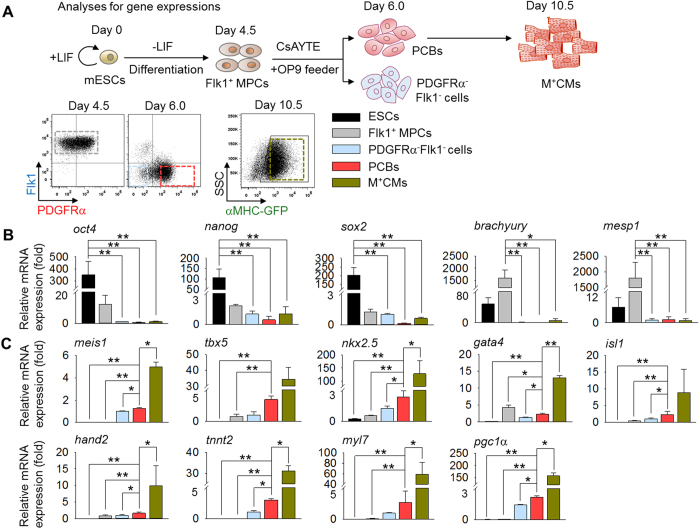
Figure 6. PCBs are at an intermediate state between MPC and differentiated cardiomyocytes.
(A) Protocol for gene expression analyses of ESCs, Flk1+ MPCs, PDGFRα-Flk1− cells, PCBs, and M+CMs. (B and C) Relative mRNA expression levels of pluripotency- (oct4, nanog and sox2), mesoderm- (brachyury, mesp1), cardiac transcription factor- (meis1, tbx5, nkx2.5, gata4, isl1 and hand2), cardiac sarcomere protein- (tnnt2 and myl7), and mitochondrial biogenesis- (pgc1α) related genes in the indicated cells. All values are relative to that of PDGFRα−Flk1− cells. In all graphs, *p < 0.05 and **p < 0.01 versus indicated cells.

