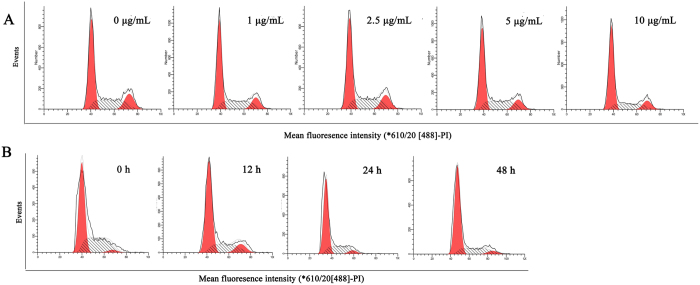
Figure 3. Effect of COP on HCT116 cell cycle progression.
Cells were stained with PI solution and analyzed using a flow cytometer. (A) Cells were treated with indicated concentrations of COP for 24 h. (B) Cells were treated with 5 μg/mL of COP for 0 to 48 h. Values represent mean ± SD with three replicates. *p < 0.05 and **p < 0.01 compared with control.

