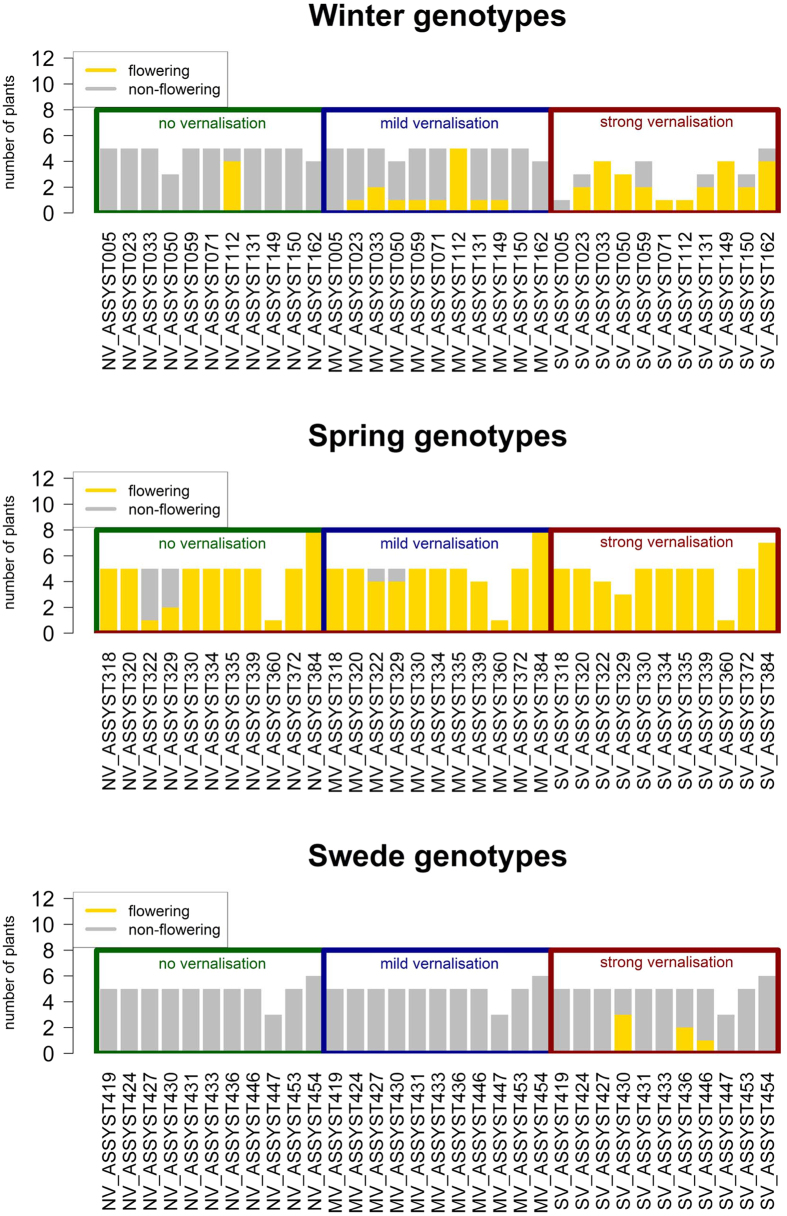
Figure 8. Distribution of flowering plants in the vernalisation trial.
The height of the bars represents the number of replications which could be phenotyped. Yellow indicates flowering plants, grey indicates non-flowering plants. The different treatments are framed in different colors, with green indicating no vernalisation, blue mild vernalisation (6 weeks) and red strong vernalisation (12 weeks).

