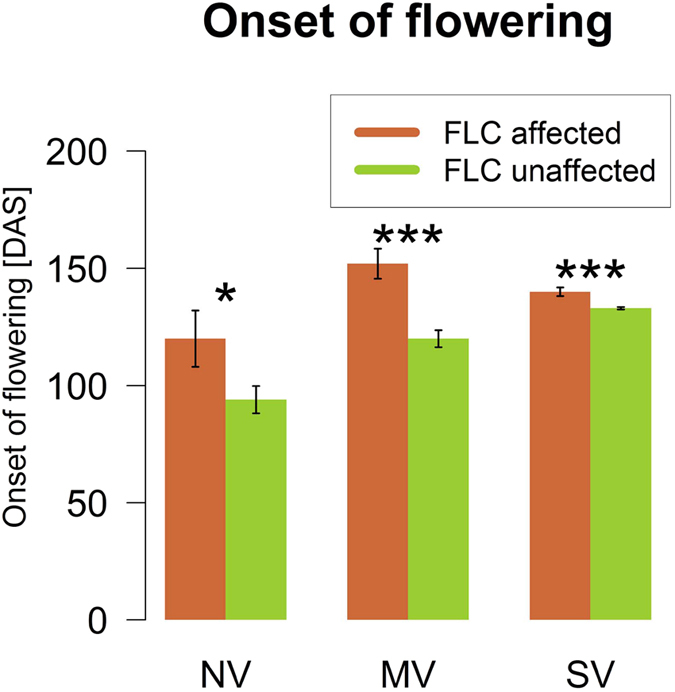
Figure 9. Barplots of flowering time recorded in days after sowing (DAS) for FLC-affected and non-affected plants among the spring genotypes in the vernalisation trial.

Whiskers show standard errors. The asterisks denote the level of significance for Student’s t-test (*p-value < 0.05, ***p-value > 0.001). NV: No vernalisation, MV: mild vernalisation (6 weeks), SV: strong vernalisation (12 weeks).
