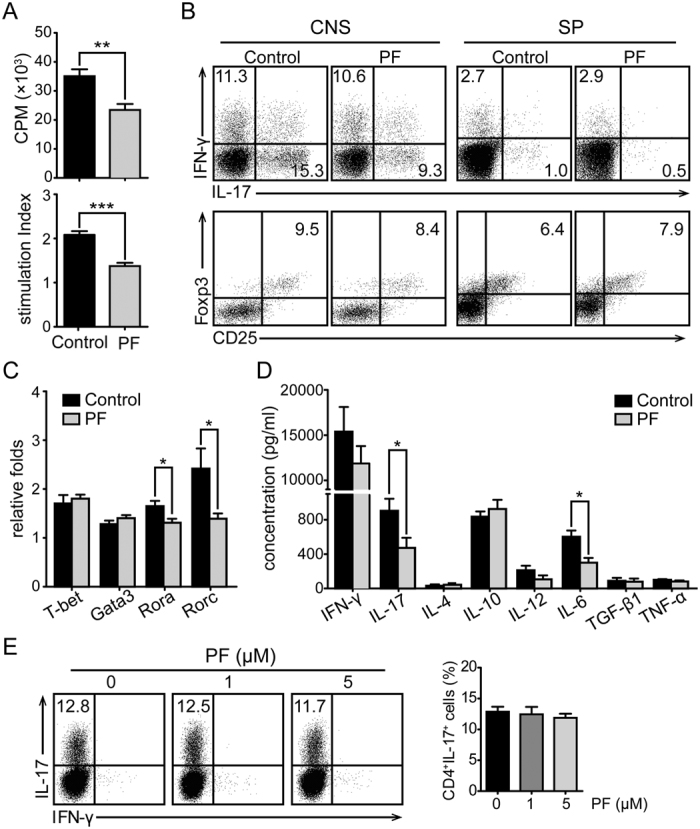
Figure 2. Encephalitogenic T cell response and cytokine profile in response to MOG35–55 peptide in EAE mice treated with PF.

Splenocytes or CNS MNCs from PF-treated or control EAE mice at day 15 post-immunization were isolated. (A) CD4+ T cells sorted from splenocytes were co-cultured with irradiated splenocytes isolated from naïve mice with the stimulation of MOG35–55 peptide and examined for proliferation. The stimulation index (SI) of CD4+ T cells was calculated as follows: SI = (the cpm value of co-cultured cells - the cpm value of irradiated splenocytes)/the cpm value of CD4+ T cells. (B) The percentage of Th1, Th17, and Treg cells in CD4+ T cells were measured by flow cytometry through intracellular staining of IL-17, IFN-γ, and Foxp3. (C) mRNA expression of T-bet, Gata3, RORα, and RORγt in CD4+ T cells were analyzed by real-time PCR. (D) Splenocytes were stimulated with MOG35–55 for 48 h, and supernatants were collected to detect the concentrations of inflammatory cytokines. Data are representative of three independent experiments with eight mice per group. Values were expressed as mean ± SEM. *p < 0.05; **p < 0.01; ***p < 0.001. (E) Naïve CD4+ T (CD4+CD62L+) cells were induced differentiation into Th17 cells in different concentrations of PF. The percentage of Th17 cells in CD4 gate was measured. Data are representative of at least three independent experiments.
