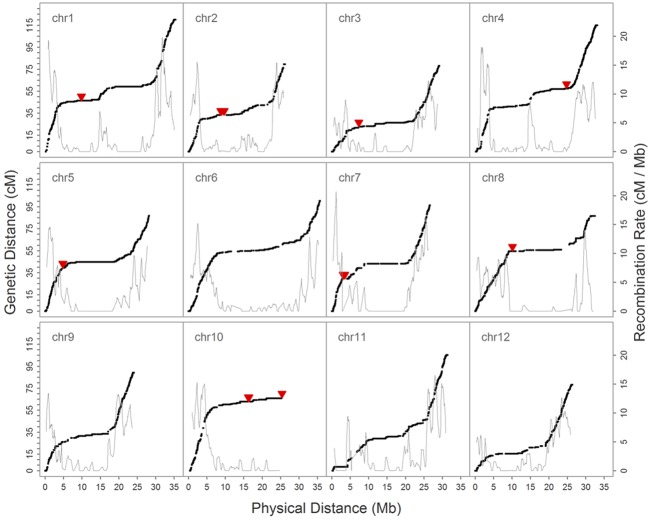
FIGURE 4.
Relationship between the genetic map and recombination rate (cM/Mb) on 12 chromosomes. The black solid dot denotes the position of SNPs on genetic and physical maps, the solid red triangle marks the physical position of 54 misallocated SNPs, and the gray solid line shows the recombination rate.

