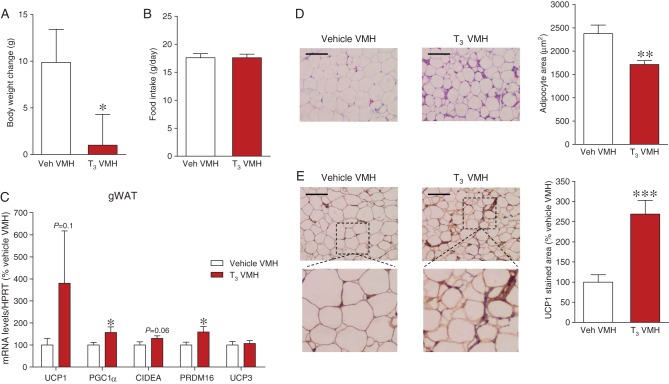
Figure 3.
Effect of T3 in the VMH on WAT browning. (A) Body weight change, (B) daily food intake, (C) mRNA expression of browning markers, (D) representative H&E staining (left panels; 20×, scale bar: 100 μm) and adipocyte area (right panels), and (E) representative immunohistochemistry with anti-UCP1 antibody showing UCP1 staining (left panels; 20×, scale bar: 100 μm), UCP1 stained area (right panels) in gWAT of vehicle- or T3-treated rats in the VMH. Statistical significance was determined by Student’s t-test. N = 7 (only for the IHC analyses)-18 animals per group. Error bars represent s.e.m. *, ** and ***P < 0.05, 0.01 and 0.001 vs vehicle.

 This work is licensed under a