
Figure 2.
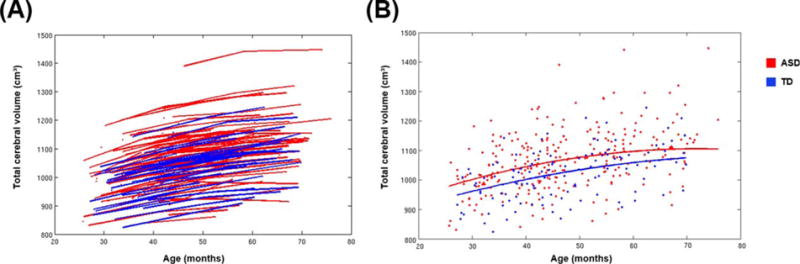
Results from longitudinal analyses of total cerebral volume. (A) Total cerebral volume data for ASD and TD subjects. Each line connects the data points collected from an individual subject. (B) Individual subject data are represented as individual data points. The lines represent the predicted growth trajectories of total cerebral volume for TD boys and all boys with ASD. All ASD boys combined had significantly greater TCV at the earliest age, and a slight but not significant increase in the rate of TCV growth over time, compared to TD boys.