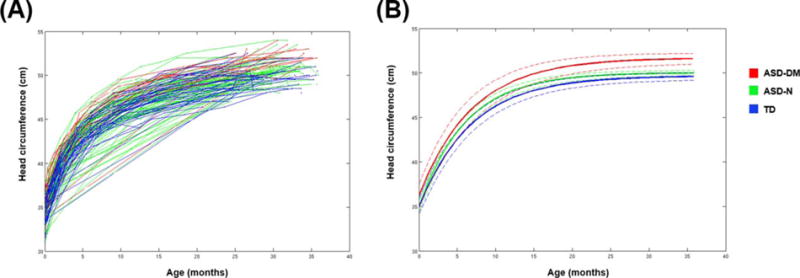
Figure 5.

Results from longitudinal analyses of head circumference for subgroups. (A) Data for head circumference for participants from each of the three subgroups: ASD-DM, ASD-N, and TD. Each line connects the data points from each individual subject. The ASD-DM group (red) fall in the upper end of the distribution, while there is a large amount of overlap between the ASD-N (green) and TD (blue) boys. (B) Predicted growth trajectories for head circumference for each of the three subgroups. Dashed lines indicate the lower and upper bounds of the 95% confidence intervals. The ASD-DM group did not differ in head circumference at birth, but reached a significantly larger final overall head size compared to the ASD-N and TD boys.
