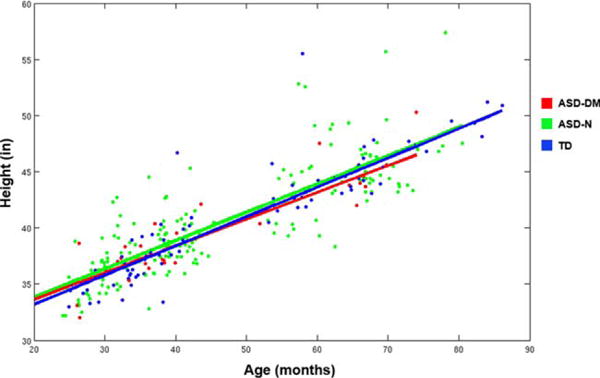
Figure 6.

Distribution of height for subjects in this study. Based on these distributions of height we obtained the predicted linear growth trajectories for body height for each subgroup as indicated by the solid lines. No significant differences were found between the three subgroups for height or rate of growth for height.
