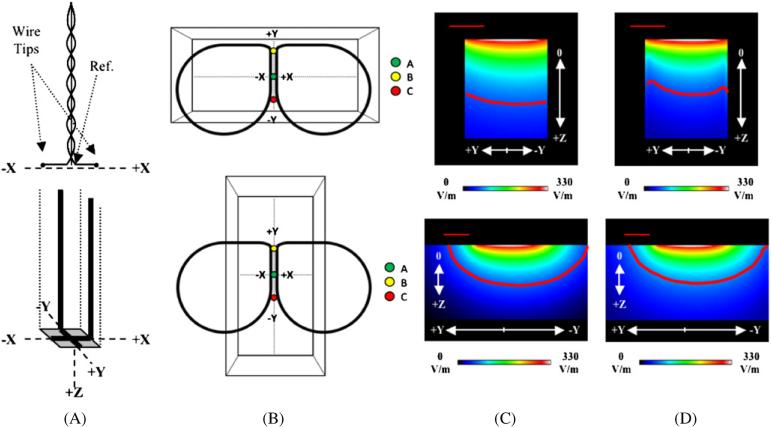
Figure 1.
(A) Schematic of the straight dipole (top) and 3D Eddy current probe (bottom). The dipole probe's wire tips and reference electrode are labeled and the coordinate systems of each probe are provided. The dipole probe's measurements are performed in one dimension; recordings in other dimensions required a rotation of the dipole probe. (B) Phantom orientations for the ‘Horizontal Box’ (top) and ‘Vertical Box’ (bottom) models. Points ‘A’, ‘B’ and ‘C’ were used for E-field measurements with the two E-field probes. The points are the same locations in both orientations. Sagittal views (yz-plane) are presented for the modeled magnitude images of the (C) primary and (D) total E-fields for the ‘Horizontal Box’ (top) and ‘Vertical Box’ (bottom) phantoms at a TMS stimulator intensity of 50%; sagittal views are at X = 0 mm. Primary E-field strengths at cortical depths—Z = 30 mm—have modeled values (on-axis) of up to 23% of the maximum E-field strength. Therefore, red contour lines (representing magnitudes greater than 20% of the maximum E-field strength) were drawn for the primary and total E-fields to show the distribution of these E-field strengths. The straight, red line in the upper left corners of the image represents a distance of 2 cm.

