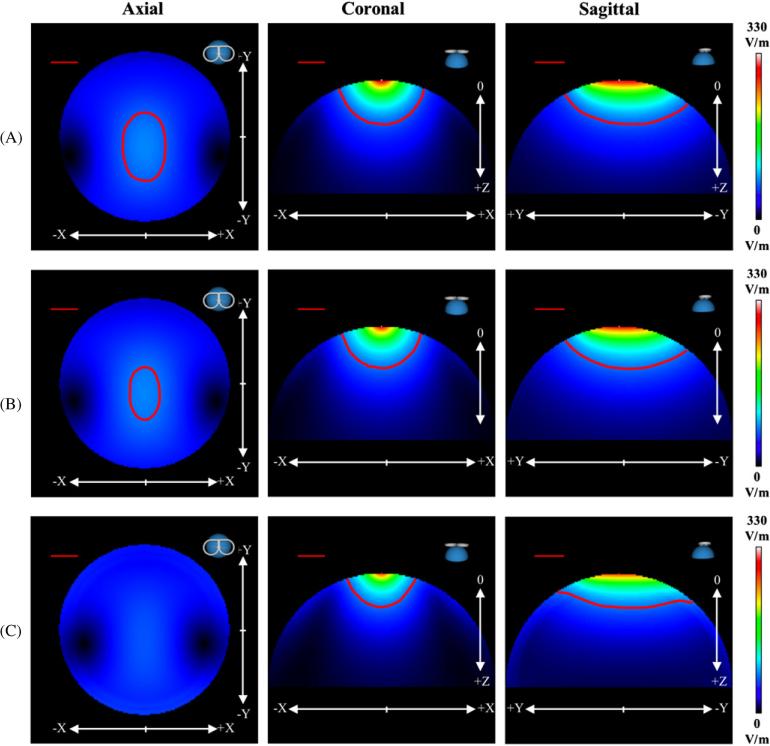
Figure 2.
Modeled 3D magnitude images of the (A) primary E-field, (B) ‘One-Shell Hemisphere’ total E-field and (C) ‘Four-Shell Hemisphere’ total E-field for a TMS stimulator intensity of 50%. The axial (xy-plane; Z = 30 mm), coronal (xz-plane; Y = 0 mm) and sagittal (yz-plane; X = 0 mm) views are presented. The red ROIs in each image represent magnitudes greater than 20% for each respective model. The ‘Four-Shell Hemisphere’ total E-field ROI is not present in the axial slice. The straight, red line in the upper left corner represents a distance of 2 cm.

