Fig. 3.
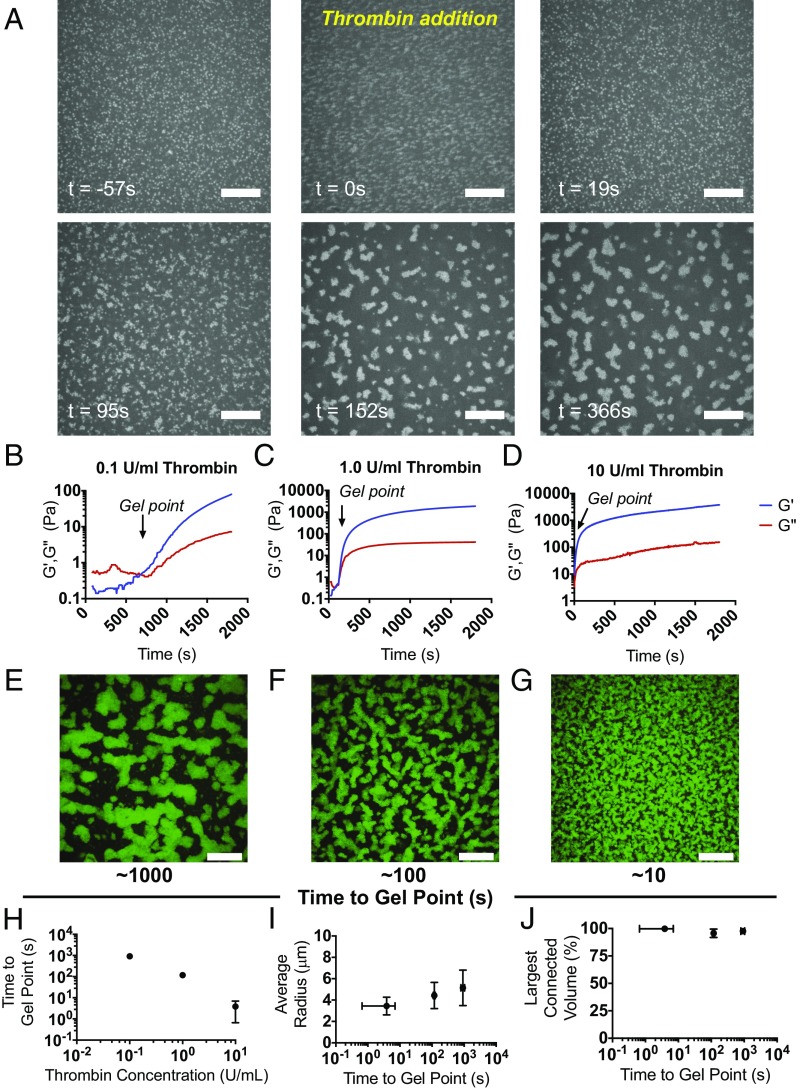
Polymerization of the bulk polymer drives μgel network formation. Fluorescently labeled μgels were imaged over time in polymerizing fibrin gels to visualize their network organization. (A) μGels are freely mobile in the fibrinogen solution (t = −57 s), thrombin is then added to initiate polymerization (t = 0 s), and then fibrin formation occurs over the next ∼100 s until the gel forms. (B–D) The elastic and viscous moduli G′ and G′′ of fibrinogen (8 mg/mL) containing μgels (ϕ = 0.11) were monitored at constant frequency and strain (0.5%, 6.28 rad/s) as a function of time, for increasing activity units of the fibrin polymerization initiator, thrombin. The average of the three independent measurements of G′ and G′′ is displayed for (B) 0.1, (C) 1.0, and (D) 10 U/mL thrombin. Order-of-magnitude increasing titrations of thrombin units lead predictably to order-of-magnitude decreases in the fibrin gel point. (E–G) Representative maximum intensity projections are shown of confocal image slices of unlabeled fibrin (8 mg/mL) with AF488-ULC μgels at ϕ = 0.11 with either (E) 0.1, (F) 1.0, or (G) 10 U/mL thrombin acquired at the end of a real-time polymerization experiment. (Scale bars, 20 μm.) (H) The time to gel point of fibrin is plotted versus thrombin concentration, demonstrating that they are approximately inversely proportional to each other. Hence as thrombin concentration increases, the gelation time decreases. Representative data of the (I) average μgel tunnel radius within a network is shown as a function of time to gel point and (J) volume occupied by the main connected μgel domain relative to the total volume occupied by the μgels. Whereas the speed of fibrin polymerization had no effect on the connectivity of the colloidal network, it did alter the dimensions of the tunnels with slower fibrin polymerization leading to larger tunnel radius.

