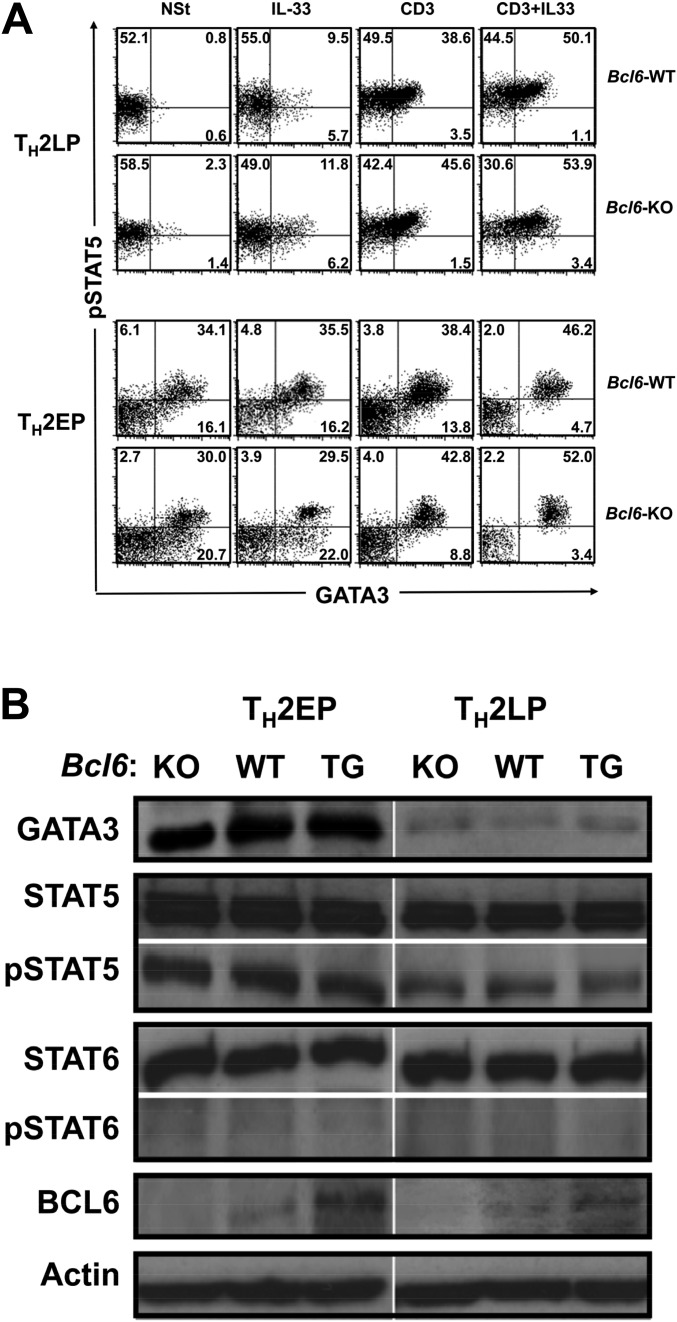
Fig. S3.
Analysis of the expression of Bcl6 and critical transcriptional factors for cytokine production in Bcl6-KO, Bcl6-WT, and Bcl6-TG TH2 cells at the EP and LP stages. (A) FACS analysis of pSTAT5- and GATA3-expressing cells among KJ-1-26+ CD4 T cells before and after IL-33 and/or TCR restimulation. The figure shows representative data for TH2EPs and TH2LPs. The numbers in each corner represent the percentages of T cells in the column. NSt, nonstimulation. (B) All FACS data are representative of three independent experiments with similar results.

