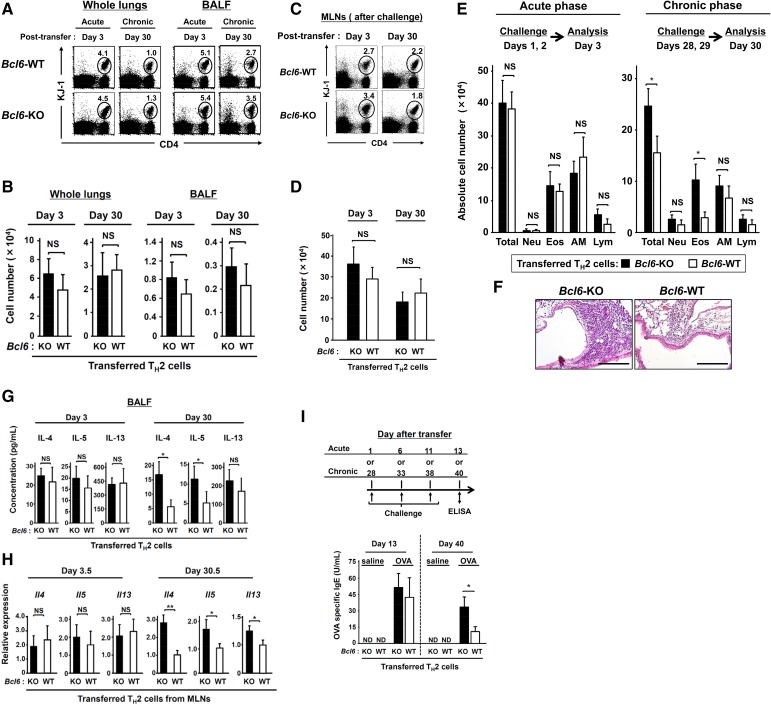
Fig. S7.
Role of Bcl6 in mTH2 cell functions for allergic responses. Despite the lack of significant differences between WT and Bcl6-KO TH2 cell migration into the recipient lungs and MLNs, Bcl6-KO mTH2 cells exacerbated allergic airway inflammation after OVA challenge during the chronic phase; conversely, no difference was observed in inflammation between recipient groups during the acute phase. TH2 cytokine levels in BALF and mRNA expression levels in MLNs also increased in Bcl6-KO TH2 cell recipients challenged during the chronic phase but not during the acute phase. (A–H) KJ-1-26+ TH2 (3 × 10⁷) cells of WT or Bcl6-KO were transferred i.v. into naïve BALB/c mice and challenged with an instillation of OVA on days 1 and 2 or 28 and 29 posttransfer. Frequencies and absolute numbers of recruited TH2 cells (KJ-1-26+) in the whole lungs and (A and B) BALF or (C and D) MLNs of recipient mice were analyzed via FACS on day 3 or 30 posttransfer (24 h after the final challenge). (A and C) Numbers indicate the percentages of KJ-1-26+ CD4+ cells (within ovals) among total lymphocytes. (E) Absolute numbers of total cells, neutrophils (Neu), eosinophils (Eos), alveolar macrophages (AM), and lymphocytes (Lym) in BALF collected from recipients postchallenge. (F) H&E-stained, formalin-fixed lung sections isolated from mice transferred with (Left) WT-TH2 cells and (Right) Bcl6-KO TH2 cells postchallenge. (Magnification: 200×.) (G) TH2 cytokine concentrations in BALF 24 h after the final challenge. (H) TH2 cytokine mRNA levels in isolated TH2 cells from MLNs at 36 h after final challenge. (I) Recipients were challenged with three instillations of either OVA or saline at 5-d intervals beginning on day 1 or 28 posttransfer. Serum from each recipient was subjected to analysis to determine the titer of OVA-specific IgE at 48 h (day 13 or 40) after the final challenge. (A, C, and F) Representative data are presented. (B, D, E, and G–I) Data are shown as means ± SEMs (n = 6–7). (A–H) All results are representative of (A–G) three and (H) four independent experiments with similar outcomes. (I) Data (means ± SDs; n = 10–12) were pooled from three independent experiments. ND, not detected; NS, not significant. *P < 0.05; **P < 0.01.

