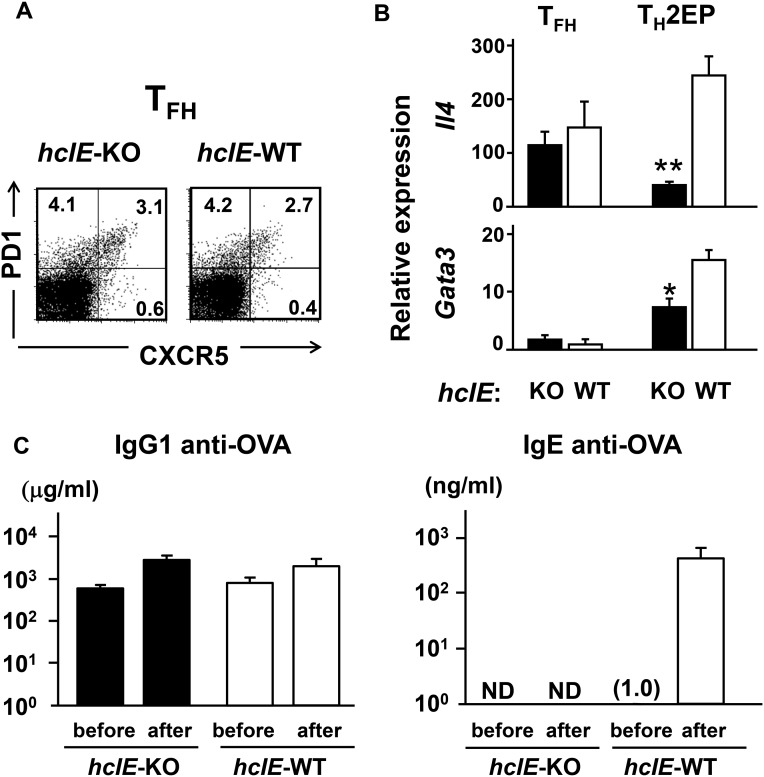
Fig. S11.
Distinct roles of hcIE in TH2 cytokine production by TFH and TH2 cells. (A) Fraction of TFH (PD1+ CXCR5+) in spleens of hcIE-KO and WT mice 9 d after immunization with DNP-OVA was analyzed within the gated CD4+ T-cell population by flow cytometry. Data are presented as a representative of three independent experiments. The numbers in each corner represent the percentages of T cells in the quadrants. TFH- and TH2-committed cells were isolated from the spleens by FACS. (B) TFH cells isolated from spleens postimmunization and TH2EPs were stimulated with plate-bound anti-CD3 Abs for 8 h. Il4 and Gata3 mRNA expression in TFH cells was analyzed by qRT-PCR. Data are indicated as means ± SEMs from three independent experiments. *P < 0.05 vs. WT; **P < 0.01 vs. WT. (C) Normal memory IgG1 response but no IgE response in hcIE-KO mice. hcIE-KO and WT mice were hyperimmunized i.p. with OVA and alum three times and then, challenged intranasally with OVA for 7 consecutive days. Data are indicated as means ± SEMs from three mice. Titers of IgG1 and IgE anti-OVA Abs in sera from the immunized mice before the first intranasal challenge and after the last challenge were measured by ELISA. ND, not detected.

