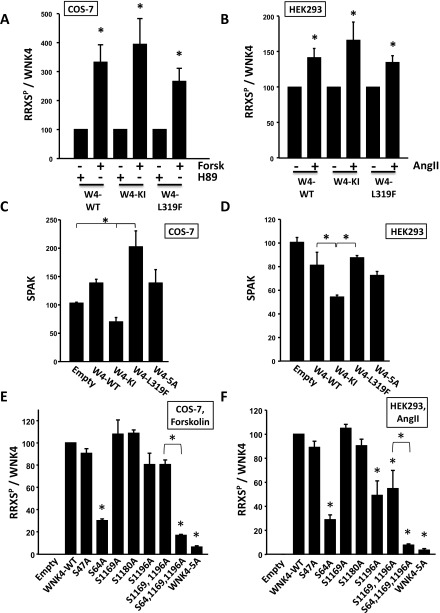
Fig. S3.
Results of the quantitation of band intensities of the blots presented in Figs. 4 and 5. (A and B) Bar graphs show the results of quantitation of the RRXSP blots of Fig. 4 A and B, respectively. Results were normalized, establishing the H89 or vehicle groups as 100%. (C and D) Results of quantitation of the SPAK blots of Fig. 4 A and B, respectively. Because no difference was observed in SPAK band intensities between the H89 and forskolin groups or the vehicle and AngII groups, these values were averaged for comparison with values obtained for other WNK4 mutants. Note that WNK4 activity levels in the cells had an impact on the level of total SPAK expression. (E and F) Results of quantitation of the RRXSP blots of Fig. 5 A and B, respectively. Results were normalized, establishing the wild-type groups as 100%. *P < 0.01.

