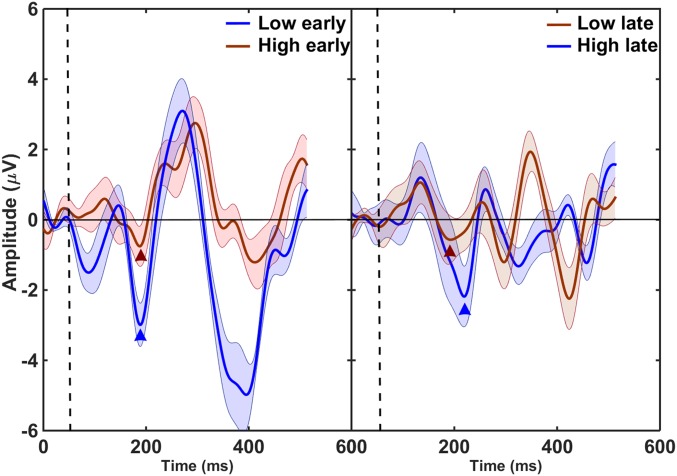
Fig. 2.
Difference waveforms showing grand average MMN responses to deviants with one tone presented 50 ms before the expected time (Left) and deviants with one tone presented 50 ms after the expected time (Right). The MMN amplitudes were larger for deviants with the low tone leading (Left, low early; Right, high late). The vertical dashed lines denote the onset of the first tone in the deviant, and the waveforms before the dashed line represent the baseline for each difference waveform. The triangles denote center positions of 50-ms windows used to calculate the MMN amplitude for each condition.

