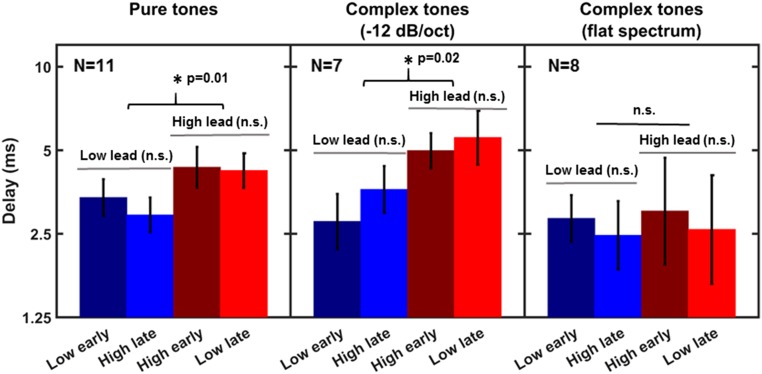
Fig. 3.
Mean thresholds for detecting rhythmic irregularity created by advancing (early) or delaying (late) one of the tones, low or high, relative to the expected time. The error bars represent ±1 SEM. The three panels show data for three different types of stimuli with the same pitch difference: pure tones (Left), spectrally shaped complex tones (Middle), and complex tones with flat spectra (Right).

