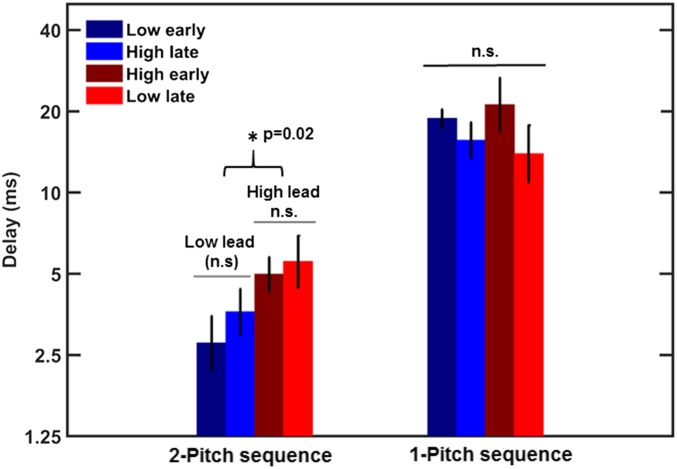
Fig. 4.
Mean thresholds for detecting rhythmic irregularity in a sequence of a one-pitch complex tone spectrally shaped with a slope of −12 dB/oct are shown by the right set of bars. The left set of bars shows thresholds for detecting a rhythmic irregularity created by manipulating the timing of one tone in a pair of low and high tones, replotted from the middle panel of Fig. 3. The error bars represent ±1 SEM. The much higher thresholds for the one-pitch sequences indicate that detecting rhythmic irregularity is more difficult than detecting a local asynchrony between two tones in the two-pitch sequence, making asynchrony a much more salient cue for detecting a temporal change in the two-pitch sequence.

