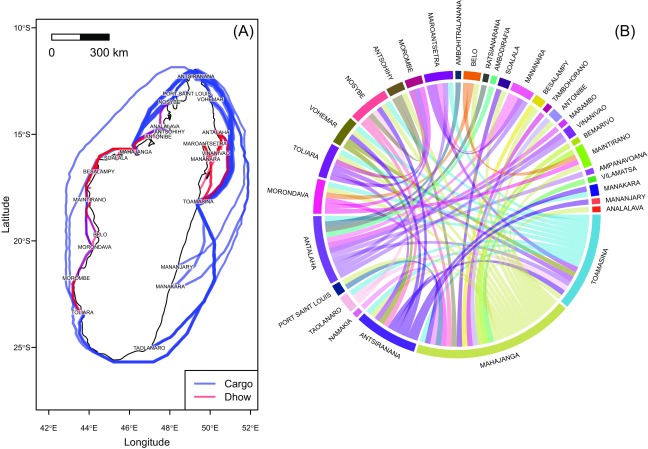
Fig. S1.
Sea trade traffic in Madagascar: coastal navigation by cargoes and dhows. (A) Pseudoroutes were computed using a least-cost distance algorithm applied on a friction surface defined by bathymetric data (The Satellite Geodesy research group at Scripps Institution of Oceanography, University of California, San Diego). Route width is proportional to the traffic intensity (tonsy− 1 in 2004). (B) Chord diagram showing the trade flows (number of flows). Data for A and B: Scetauroute International (57).

