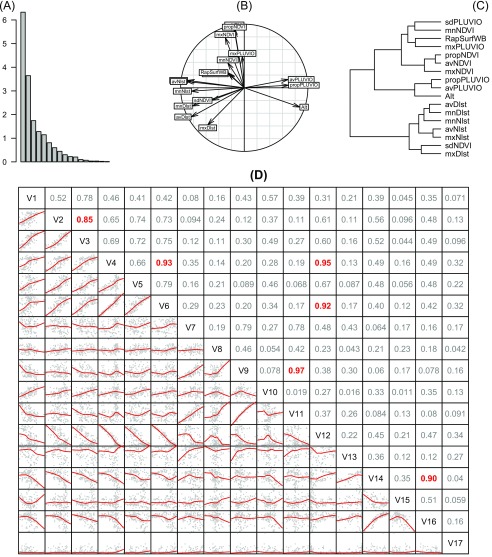
Fig. S4.
Exploratory data analysis for the 18 predictors of sero-prevalence rate in cattle. (A–C) PCA (A) eigenvalues, (B) correlation circle for the variables, and (C) hierarchical clustering on the PCA scores. (D) Matrix of scatter plots: variable names on the diagonal: V1, mxDlst; V2, mnDlst; V3, avDlst; V4, mxNlst; V5, mnNlst; V6, avNlst; V7, mxNDVI; V8, mnNDVI; V9, avNDVI; V10, sdNDVI; V11, propNDVI; V12, Alt; V13, mxPLUVIO; V14, avPLUVIO; V15, sdPLUVIO; V16, propPLUVIO; V17, RapSurfWB. Below the diagonal, red curves are loess smoothing lines. Above the diagonal, numbers are the linear correlation coefficients, in red for .

