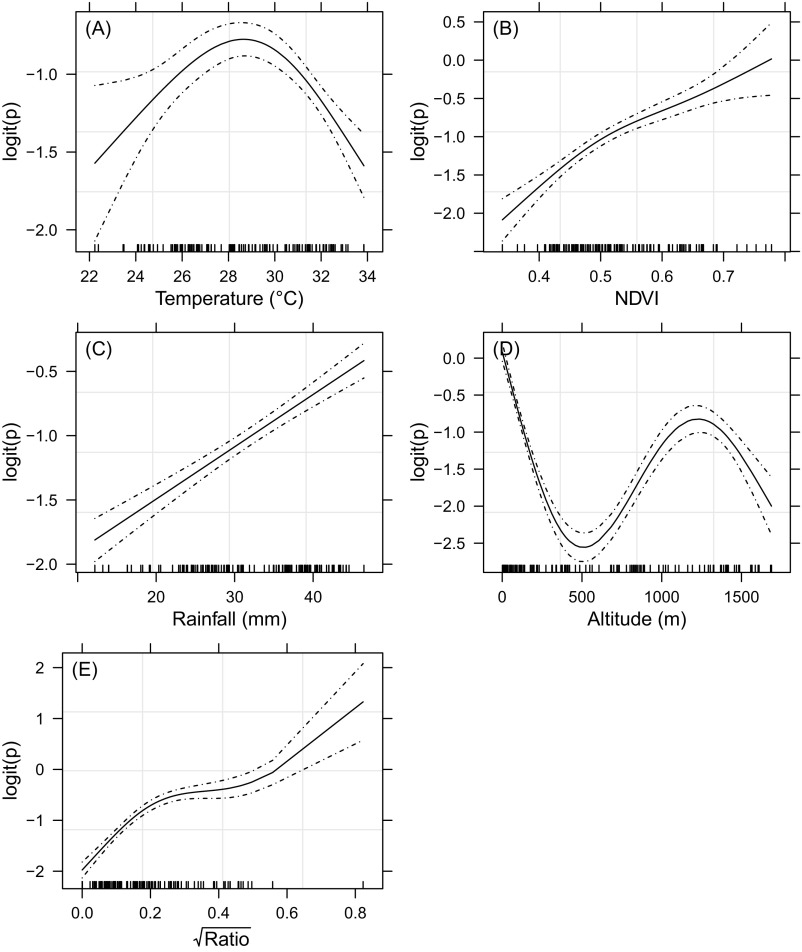
Fig. S5.
Trend in anti-RVFV IgG sero-prevalence rate in cattle (logit scale) as a smoothing-spline function of the predictor. (A) Average DLST. (B) Average NDVI. (C) Average monthly rainfall. (D) Altitude. (E) Square root of the surface water ratio. Observed data are indicated by small tick marks on the axis; the solid and dashed lines show the trend and its 95% CI.

