Fig. 4.
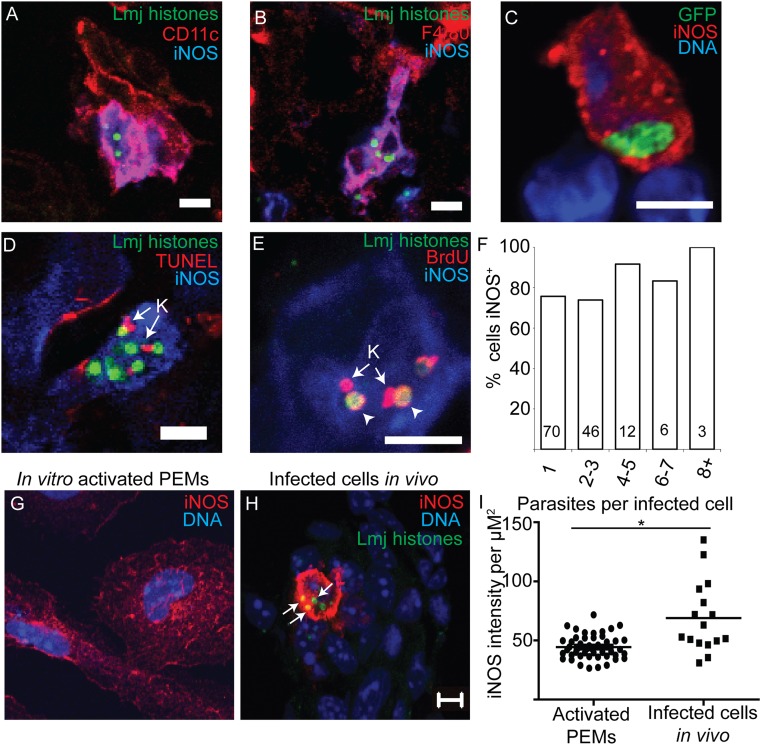
PIPs are morphologically intact and replicate within iNOS-expressing cells. (A and B) Representative images of parasite nuclei (green) within iNOS-positive CD11c+ (A) or F4/80+ cells (B) in persistently infected footpad tissue. (C) GFP-expressing L. major (green) within iNOS-positive cells in persistently infected tissue shows expected morphology for intracellular parasites. (D) TUNEL labeling of PIPs within iNOS-expressing cells. K (arrow), kinetoplast showing TUNEL+. No TUNEL labeling of parasite nuclei was observed. n = 2E/3M/80P. (E) BrdU labeling of PIPs within iNOS-expressing cells. K, kinetoplast showing BrdU-labeling. Arrowheads, BrdU+nuclei. (F) Percent of clusters within iNOS+ cells plotted as a function of the number of intracellular parasites per cell. Numbers within the bars are the number of cells visualized. (Scale bar, 5 µM.) (G) Representative image of starch elicited PEMs that were cultured in the presence of IFN-γ and LPS for 24 h and then stained to detect parasite histones (green), iNOS (red), and nuclei (blue). (H) Representative image of an infected cell in footpad tissue stained and imaged identically to the cells in G. Arrows, PIP nuclei within iNOS+ cells. Images of activated MΦs in vitro or iNOS-expressing infected cells from footpad tissue were captured by confocal microscopy using identical settings. (Scale bar, 5 µm.) (I) Comparison of average red (iNOS) fluorescence intensity per µm2 within in vitro-activated PEMs or iNOS-expressing infected cells from footpad tissue. Each data point represents one cell. Black horizontal bars represent mean for all cells. *P < 0.05, Student’s t test.

