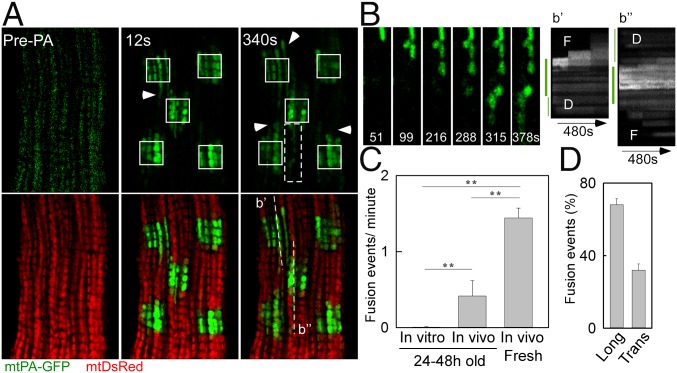
Fig. 2.
Mitochondrial fusion in freshly isolated AVCMs. (A) A representative AVCM before and after 2P PA of mtPA-GFP (white squares). At 12 s, the spreading of mtPA-GFP fluorescence indicates matrix continuity among mitochondria (arrowhead). At 340 s, newly formed communication (arrowheads) is observed. (B, Left) mtPA-GFP time series for the area marked by the white-dashed box in A, denoting serial fusion events in a longitudinal orientation. (B, Right) Here b′ and b′′ represent a line-scan analysis of the indicated dashed lines in A. The thick green line indicates the PA area. D, initial diffusion of mtPA-GFP toward the vicinity of the PA region, also denoted by the thin green line on the left. F, step-like mtPA-GFP fluorescence transfer corresponding to fusion event. (C) Fusion frequency in cultured and freshly isolated AVCMs (in vitro-transformed AVCMs cultured for 24–48 h: 26 cells, seven experiments; in vivo-transformed AVCMs cultured for 24 h: nine cells, two experiments; in vivo-transformed freshly isolated AVCMs: 34 cells, four experiments). **P < 0.01. (D) Frequency of longitudinal (Long) and transverse (Trans) fusion events.

