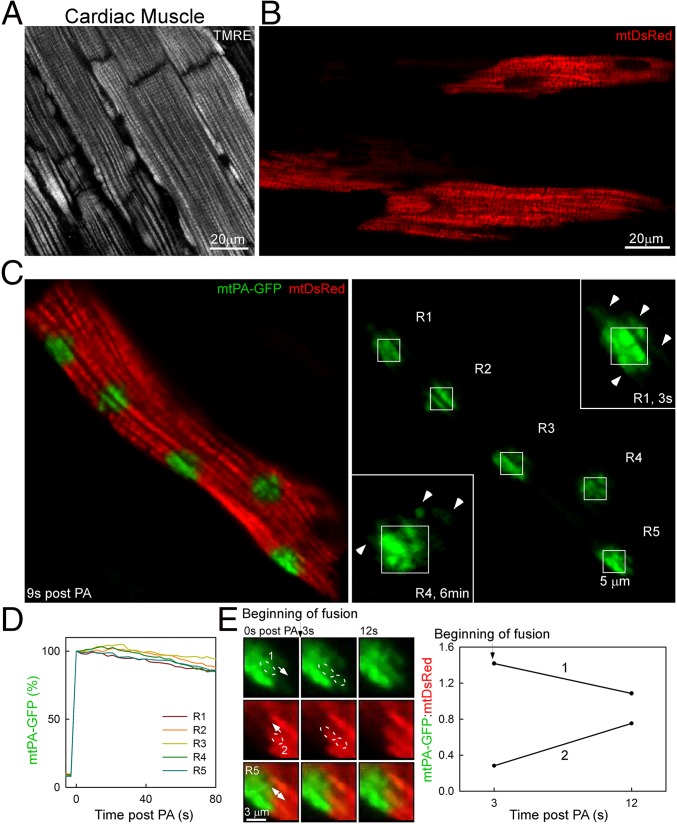
Fig. 4.
Mitochondrial continuity and fusion events in the whole heart. (A) Ventricular myocytes in the outer layer of the ventricular wall of a TMRE-perfused whole heart. (B) Ventricular myocytes from an in vivo-transformed whole heart showing mtDsRed fluorescence. (C) A ventricular myocyte in the whole heart. Right side mtPA-GFP image denotes five PA regions (R1–5). R1 and R4 were zoomed in at 3 s and 6 min, respectively. (D) Plot showing the mtPA-GFP decay kinetics in the PA area. (E) Images of a time series of a fusion event between two adjacent mitochondria, 1 and 2. The plot shows the opposite fluorescence transfer as the mtPA-GFP/mtDsRed ratio for each organelle.

