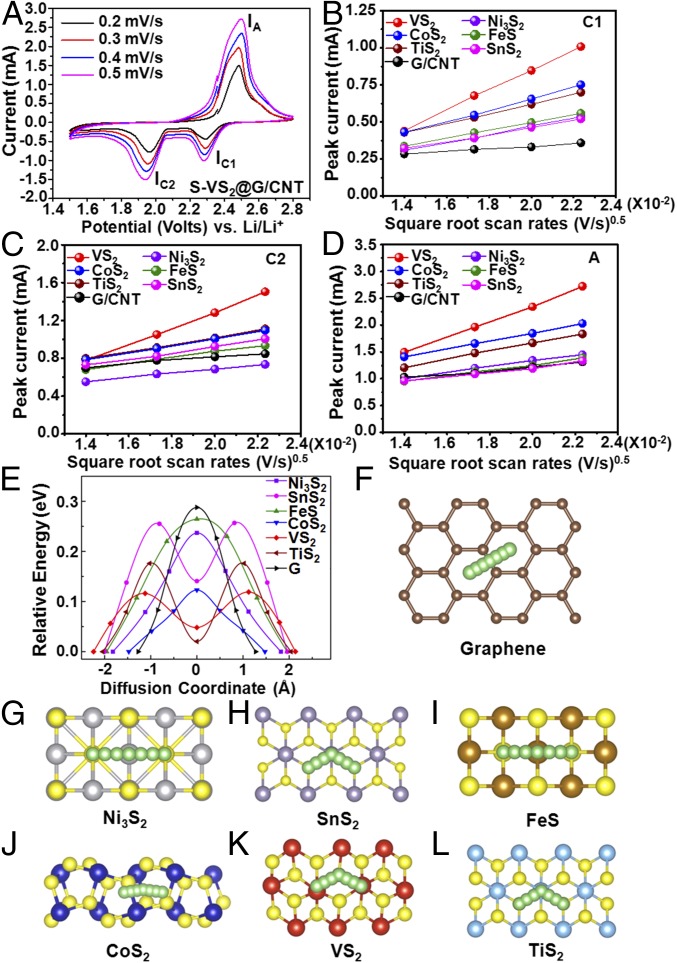
Fig. 4.
Lithium ion diffusion properties on the surface of graphene and various metal sulfides with mechanism analysis. (A) CV curves of the S−VS2@G/CNT electrode at various scan rates. Plots of CV peak current for the (B) first cathodic reduction process (IC1: S8→Li2Sx), (C) second cathodic reduction process (IC2: Li2Sx→Li2S2/Li2S), and (D) anodic oxidation process (IA: Li2S2/Li2S→S8) versus the square root of the scan rates. (E) Energy profiles for diffusion processes of Li ion on Ni3S2, SnS2, FeS, CoS2, VS2, TiS2, and graphene. Top view schematic representations of corresponding diffusion pathways for (F) graphene, (G) Ni3S2, (H) SnS2, (I) FeS, (J) CoS2, (K) VS2, and (L) TiS2. Here, green, yellow, gray, purple, brown, blue, red, cyan, and beige balls represent lithium, sulfur, nickel, tin, iron, cobalt, vanadium, titanium, and carbon atoms, respectively.

