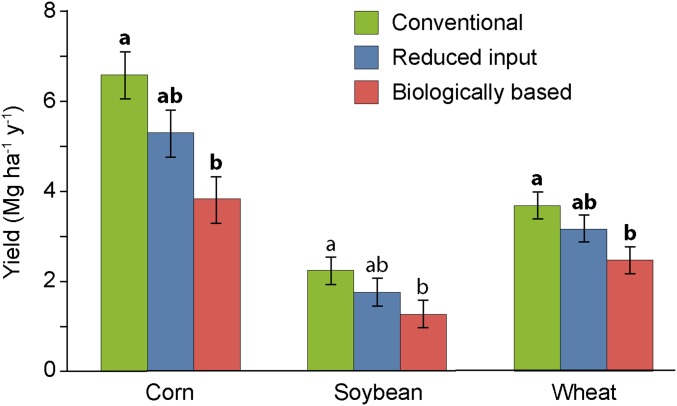
Fig. 1.
Field-scale average yields of corn, soybean, and wheat in Conv, RI, and Bio management practices for 2007–2012 (n = 3). Error bars represent SEs. Different letters within each crop denote statistically significant differences among the management practices at P < 0.05 (boldface type) and P < 0.1 levels.

