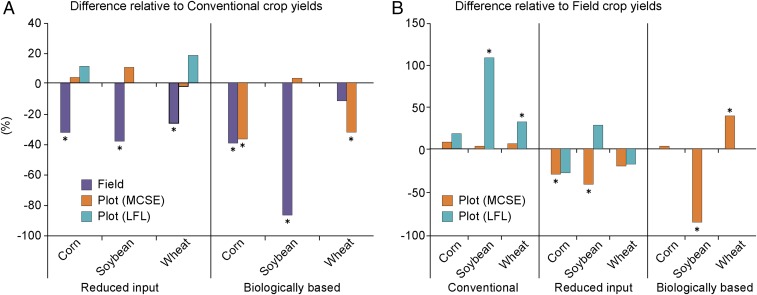
Fig. 3.
Relative differences in crop yields (A) between conventional vs. reduced-input and biologically based management practices within each experiment and (B) between field-scale and plot-scale (MSCE and LFL) experiments for each management practice. The differences are calculated for corn (2008 and 2011), soybean (2009 and 2012), and wheat (2007 and 2010) as percentage of decrease in yield compared with the yield of the conventional management (shown in A) and as percentage of difference in yield compared with plot-scale practices for the field (n = 3) and plot-scale [MCSE (n = 6) and LFL (n = 4)] experiments (shown in B). Asterisks in A mark the differences that were significantly less than zero at P < 0.05, and asterisks in B mark differences significantly different from zero at P < 0.1.

