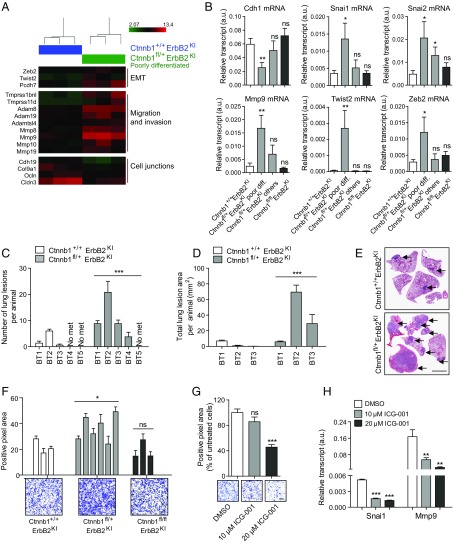
Fig. 6.
Poorly differentiated Ctnnb1fl/+ErbB2KI tumors exhibit an EMT signature and are more metastatic. (A) Heat map of selected genes differentially expressed between Ctnnb1+/+ErbB2KI and poorly differentiated Ctnnb1fl/+ErbB2KI tumors. (B) A panel of EMT genes (Cdh1, Mmp9, Snai1/2, Twist2, and Zeb2) were validated by RT-PCR. Ctnnb1+/+ErbB2KI, n = 8; Ctnnb1fl/+ErbB2KI poor differentiation, n = 6; Ctnnb1fl/+ErbB2KI others, n = 6; Ctnnb1fl/flErbB2KI, n = 5. Error bar: SEM. *P < 0.05 (Student’s t test); **P < 0.005 (Student’s t test). (C and D) Freshly dissociated cells (0.5 × 10³) from five independent primary tumors per genotype were injected into the tail vein of groups of five athymic mice. Lungs were harvested 4 wk postinjection, and the number and area of lung lesions were scored. Error bar: SEM. ***P < 0.0005 (two-way ANOVA). (E) Representative images of lungs collected 4 wk post tail vein injection. Arrows point to lung metastases. (Scale bar: 0.4 mm.) (F, Upper) Primary tumor cells were subjected to a Boyden transwell invasion assay in the presence of matrigel. Average positive pixel areas for each cell line were calculated from crystal violet-stained membranes. Data were averaged from three independent experiments. Error bar: SD. *P < 0.05 (Student’s t test). (F, Lower) Images show representative crystal violet-stained membranes. (Scale bar: 200 μm.) (G) Cells derived from a poorly differentiated Ctnnb1fl/+ErbB2KI tumor were pretreated with ICG-001 or DMSO for 36 h before being subjected to a Boyden transwell invasion assay. Data were averaged from three independent experiments. Error bar: SD. (Scale bar: 300 μm.) ***P < 0.0005 (Student’s t test). (H) Total RNA was extracted from Ctnnb1fl/+ErbB2KI cells (derived from a poorly differentiated tumor) treated with ICG-001 or DMSO for 3 d, and transcript levels of β-catenin target genes Snai1 and Mmp9 were assessed by RT-PCR. Data were averaged from three independent runs and normalized to Gapdh. Error bar: SD. ns, Not significant. **P < 0.005 (Student’s t test); ***P < 0.0005 (Student’s t test).

