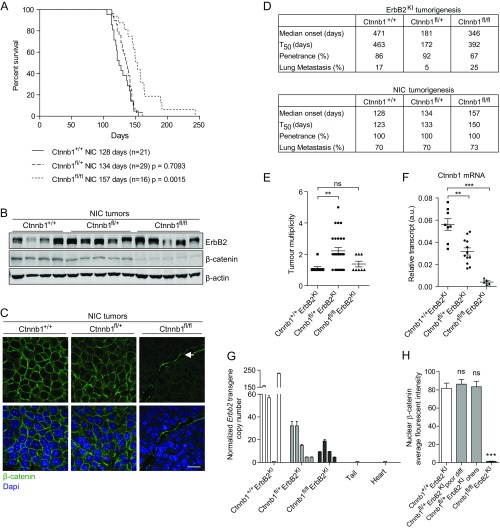
Fig. S1.
Tumor kinetics. (A) Kaplan–Meier analysis of tumor onsets shows the consequences of β-catenin deletion during NIC tumorigenesis. Statistical significance determined by Student’s t test. Median tumor onsets (days) are indicated for each mouse cohort. (B) Immunoblot analysis confirms expression of ErbB2 and loss of β-catenin. (C) β-Catenin was visualized by IHF. Arrow points to stromal cells. Ctnnb1+/+NIC, n = 5; Ctnnb1fl/+NIC, n = 5; Ctnnb1fl/flNIC, n = 5. (Scale bar: 20 μm.) (D) Summary of tumor kinetics and lung metastasis of both ErbB2KI and NIC models. (E) Number of tumors at end point (6 wk postpalpation) in ErbB2KI model. **P < 0.005 (Student's t test). (F) Transcript levels of β-catenin (Ctnnb1) were assessed by RT-PCR to confirm gene KO. **P < 0.005 (Student’s t test); ***P < 0.0005 (Student’s t test). (G) Copy number of Erbb2 transgene was assessed by RT-PCR with genomic DNA using primers specific to Erbb2 transgene and normalized to another genomic location (a reference location) in ErbB2KI tumors. DNA extracted from tail and heart served as a negative control for Erbb2 amplification. (H) Nuclear β-catenin fluorescent intensity was quantified from IHF images. At least 30 nuclei were scored and averaged for each tumor. Ctnnb1+/+ErbB2KI, n = 4; Ctnnb1fl/+ErbB2KI poor differentiation, n = 4; Ctnnb1fl/+ErbB2KI others, n = 3; Ctnnb1fl/flErbB2KI, n = 3. Error bar: SEM. ns, Not significant. ***P < 0.0005 (Student’s t test).

