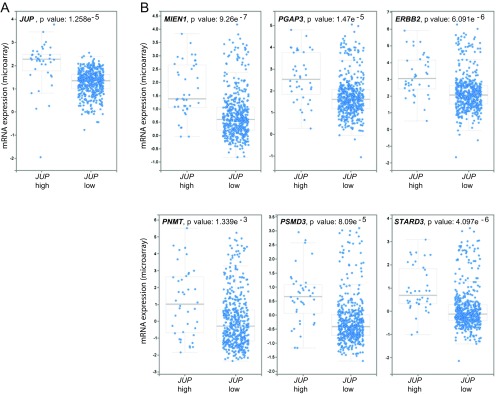
Fig. S5.
Interrogation of gene expression data from 1,105 breast tumor samples (The Cancer Genome Atlas; Cell 2015; mRNA expression dataset). (A) All breast cancer cases were categorized into two groups based on plakoglobin (JUP) mRNA expression: high plakoglobin z scores > 2.5 and low plakoglobin z scores < 2.5. (B) Cases with high plakoglobin expression also have high levels of genes belonging to the ERBB2 amplicon [MIEN1 (C17ORF37), PGAP3 (PERLD1), PNMT, PSMD3, and STARD3]. Data were mined through cBioPortal.

