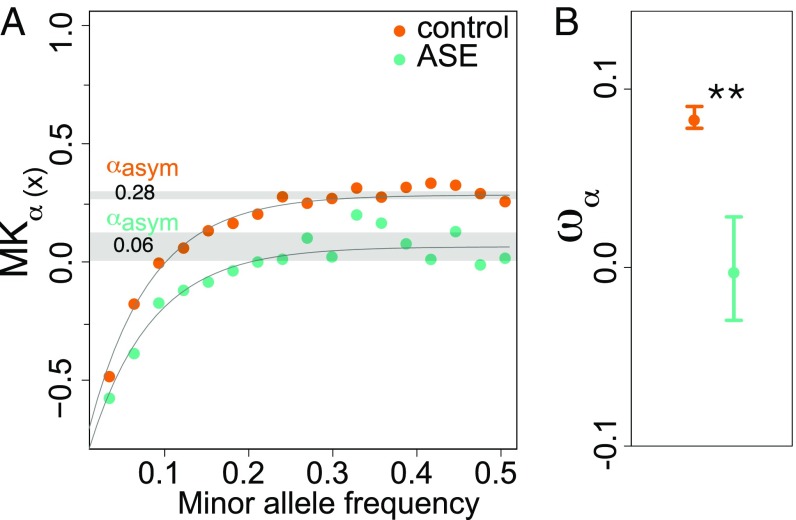
Fig. 3.
A lower proportion of adaptive nonsynonymous fixations (α) at genes with ASE. (A) Estimation of α using an asymptotic method that fits an exponential function to estimates of α based on polymorphisms at different frequencies. Orange dots show values for control genes, and green dots show values for genes with ASE. The gray shaded area indicates 95% confidence intervals. The point estimate for genes with and without ASE is 0.06 and 0.28, respectively. (B) The estimated proportion of adaptive fixations relative to fourfold synonymous substitutions (ωα) for genes with and without ASE. Whiskers correspond to 95% confidence intervals, and significance levels for comparisons of ASE and control genes are indicated by asterisks (*P ≤ 0.05; **P ≤ 0.01).

