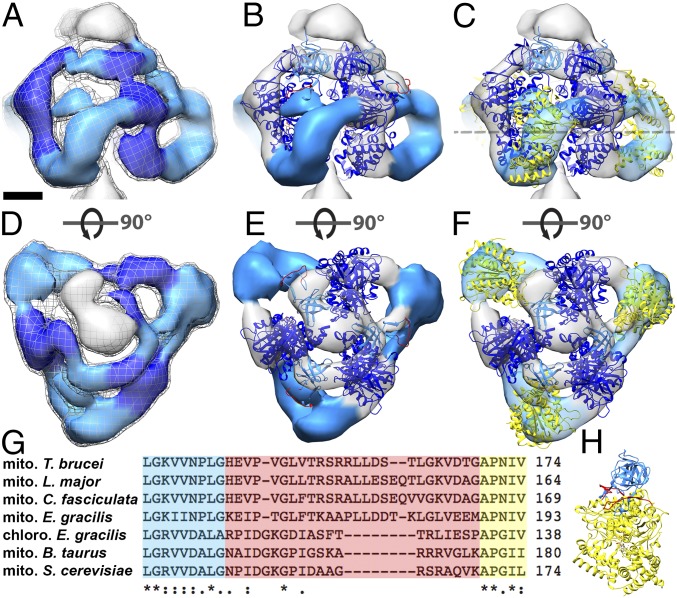
Fig. 2.
Fit of the atomic model to the catalytic region of mitochondrial ATP synthase dimers from E. gracilis. Side views (A–C) and matrix views (D–F) of the F1 head region in the subtomogram average of E. gracilis ATP synthase dimer. (A and D) Subtomogram average. (B and E) The same as A and D, with a fitted atomic model of the bovine (αβ)3 hexamer (PDB ID code 1BMF) (4) without αc. (C and F) The same as B and E, but with αc fragments fitted as a rigid body. The dashed line indicates a cross-sectional plane for Fig. 4 A–C. (G) Sequence alignment of the mitochondrial (mito) α subunit of T. brucei, Leishmania major, C. fasciculata, E. gracilis, Bos taurus, and Saccharomyces cerevisiae, and the chloroplast (chloro) α subunit of E. gracilis. Blue, C-terminal sequence of αN; yellow, N-terminal sequence of αc; red, nonconserved loop region and region of protease cleavage site in mitochondrial α subunit of euglenozoa. (H) α subunit of bovine heart ATP synthase color-coded as in G. Light blue, αN; yellow, αc; red, loop with protease cleavage site; dark blue, β subunit. (Scale bar in A–F: 2.5 nm.) See also Movie S2, Fig. S2, and Fig. S3.

