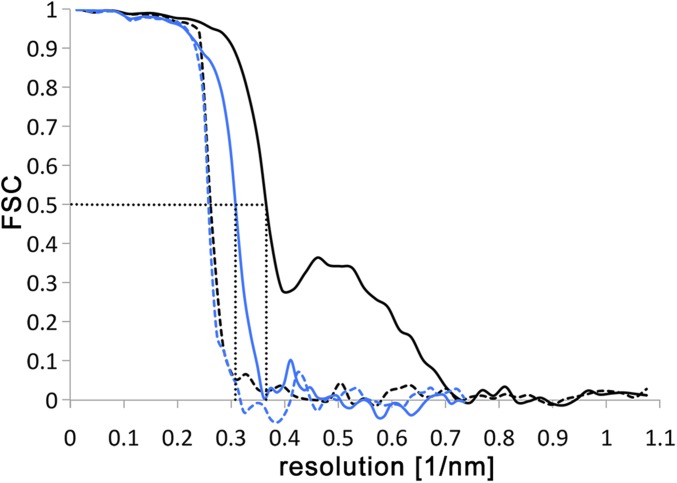
Fig. S1.
Resolution estimates of subtomogram averages. FSC curves of the ATP synthase dimer averages from E. gracilis (black) and T. brucei (blue). To assess mask bias, FSC was performed on half-maps created from tomograms with phases randomized beyond 40 Å (dashed lines). The correlation drops at the resolution above which the phases were randomized, indicating that the mask does not affect the resolution estimate. FSC curves for the E. gracilis and T. brucei maps indicate resolutions of 27.5 Å and 32.5 Å for the two maps using the 0.5 FSC criterion (59) (dotted lines).

