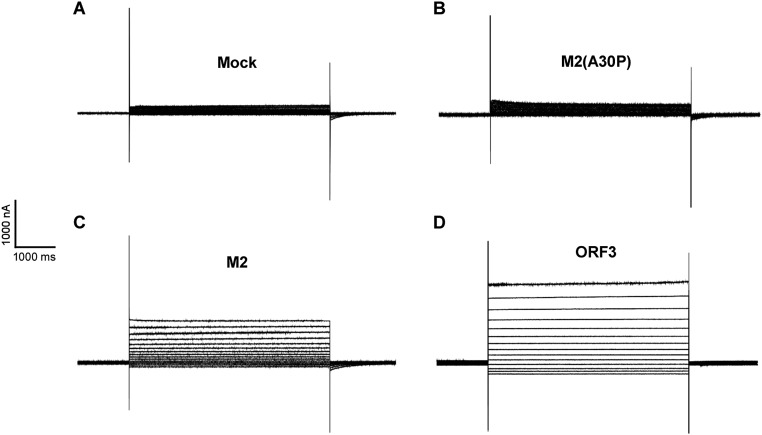
Fig. S3.
Current traces demonstrating the viroporin function of HEV ORF3. Representative current traces showing baseline current in mock (A) and IAV M2(A30P)-injected oocytes (B). Traces of burst activity in X. laevis oocytes injected with IAV M2 (C) or HEV ORF3 (D). Scales for time (horizontal axis) and current (vertical axis) are shown.

