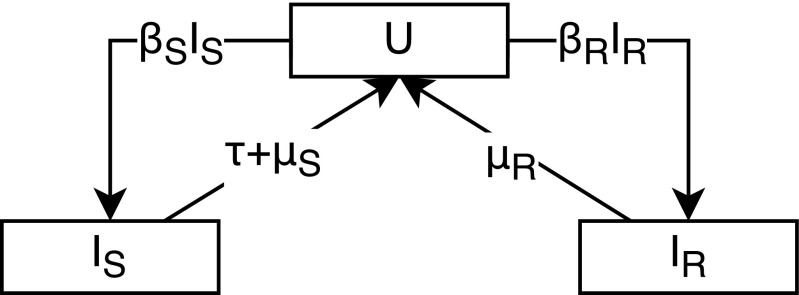
Fig. 1.
Model of competition between antibiotic sensitive and resistant strains (Eq. 1). represents uninfected hosts, represents hosts infected with the sensitive strain, represents hosts infected with the resistant strain, is the transmission rate, is the clearance rate, is the population antibiotic consumption rate, and , where and represent the cost of resistance.

